Fig. B.2
Download original image
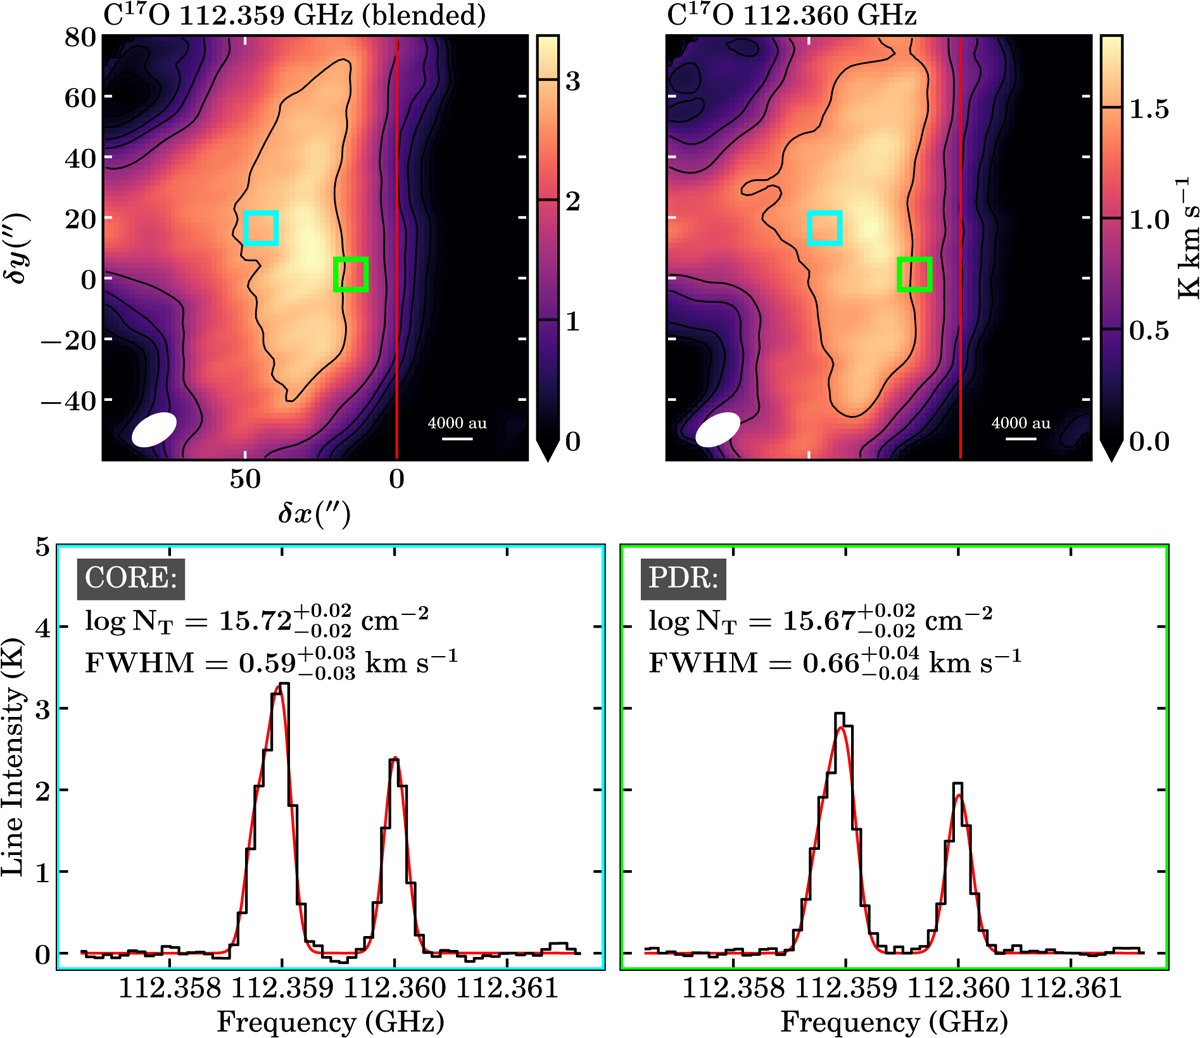
Top row: ALMA 7 m+30 m zeroth-moment maps of the hyperfine components of the C17O J = 1–0 rotational transition resolved at the Horsehead edge. The rotation angle and red vertical line are the same as in Fig. 2. The contours are [5, 10, 20, 30, 50, 100] × σ, where σ is the zeroth-moment rms listed in Table 1. The dense core and PDR positions are marked with cyan and green squares, respectively, indicating the regions where the spectra were extracted. The beam size and a scale bar indicating 4000 au are shown in the bottom left and bottom right corner, respectively, of each panel. Bottom row: C17O spectra extracted at the dense core and PDR positions, shown using matching colors to the map markers. The best-fit models are overlaid in red. The best-fit excitation conditions and associated uncertainties, presented in the top left corner of each panel, correspond to the 16th, 50th, and 84th percentiles of the posterior distributions.
Current usage metrics show cumulative count of Article Views (full-text article views including HTML views, PDF and ePub downloads, according to the available data) and Abstracts Views on Vision4Press platform.
Data correspond to usage on the plateform after 2015. The current usage metrics is available 48-96 hours after online publication and is updated daily on week days.
Initial download of the metrics may take a while.