Fig. B.3
Download original image
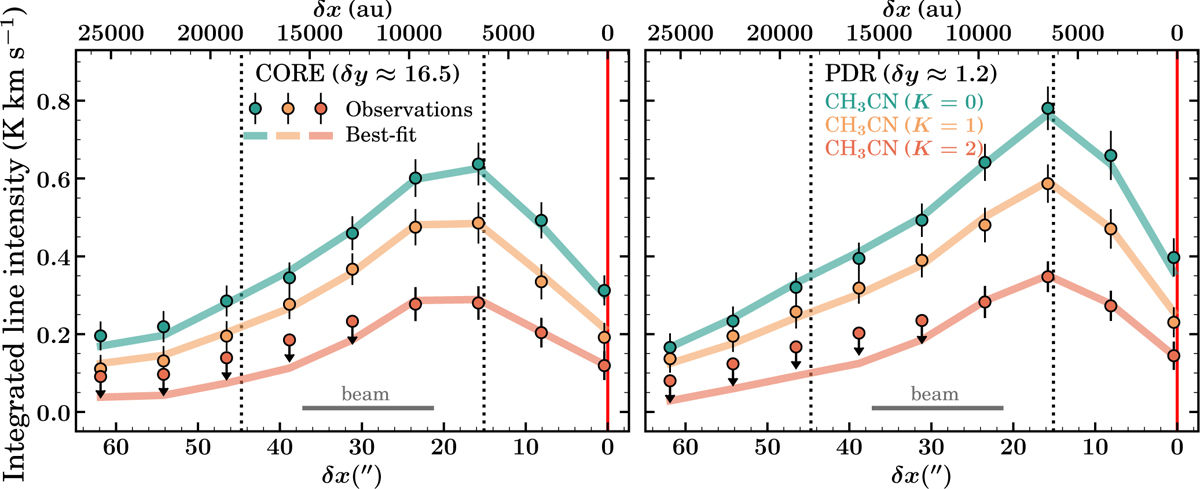
Integrated intensity profiles of the CH3CN J = 6 − 5 (K = 0, 1, and 2) transitions at the δy positions of the dense core (left panel) and the PDR (right panel), as obtained from the ALMA 7 m+30 m observations. Each color corresponds to a different K-ladder transition, as indicated by the labels in the right panel. The observed data points are shown as circles, and the best-fit models are overlaid as solid lines in the corresponding colors. The red vertical line, the dotted vertical lines, and the horizontal gray bar are the same as in the left panels of Fig. 3.
Current usage metrics show cumulative count of Article Views (full-text article views including HTML views, PDF and ePub downloads, according to the available data) and Abstracts Views on Vision4Press platform.
Data correspond to usage on the plateform after 2015. The current usage metrics is available 48-96 hours after online publication and is updated daily on week days.
Initial download of the metrics may take a while.