Fig. 1
Download original image
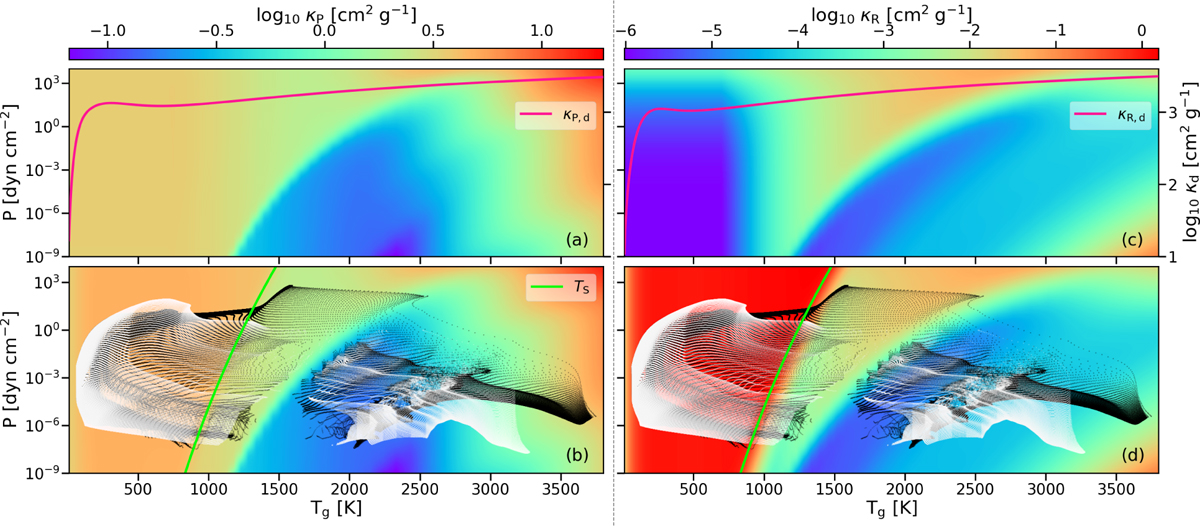
Planck (panels a and b) and Rosseland (panels c and d) mean opacities. Panels a and c: maps of the temperature- and pressure-dependent gas mean opacities. The pink lines represent the dust mean opacities as functions of temperature. Panels b and d: final effective mean opacities, with the lime-coloured contour indicating the dust sublimation temperature, TS, for each pressure value. The white and black dots mark the temperaturepressure pairs that occur in our simulations, representing a snapshot of the quiescent and the outburst stage, respectively.
Current usage metrics show cumulative count of Article Views (full-text article views including HTML views, PDF and ePub downloads, according to the available data) and Abstracts Views on Vision4Press platform.
Data correspond to usage on the plateform after 2015. The current usage metrics is available 48-96 hours after online publication and is updated daily on week days.
Initial download of the metrics may take a while.