Fig. 11
Download original image
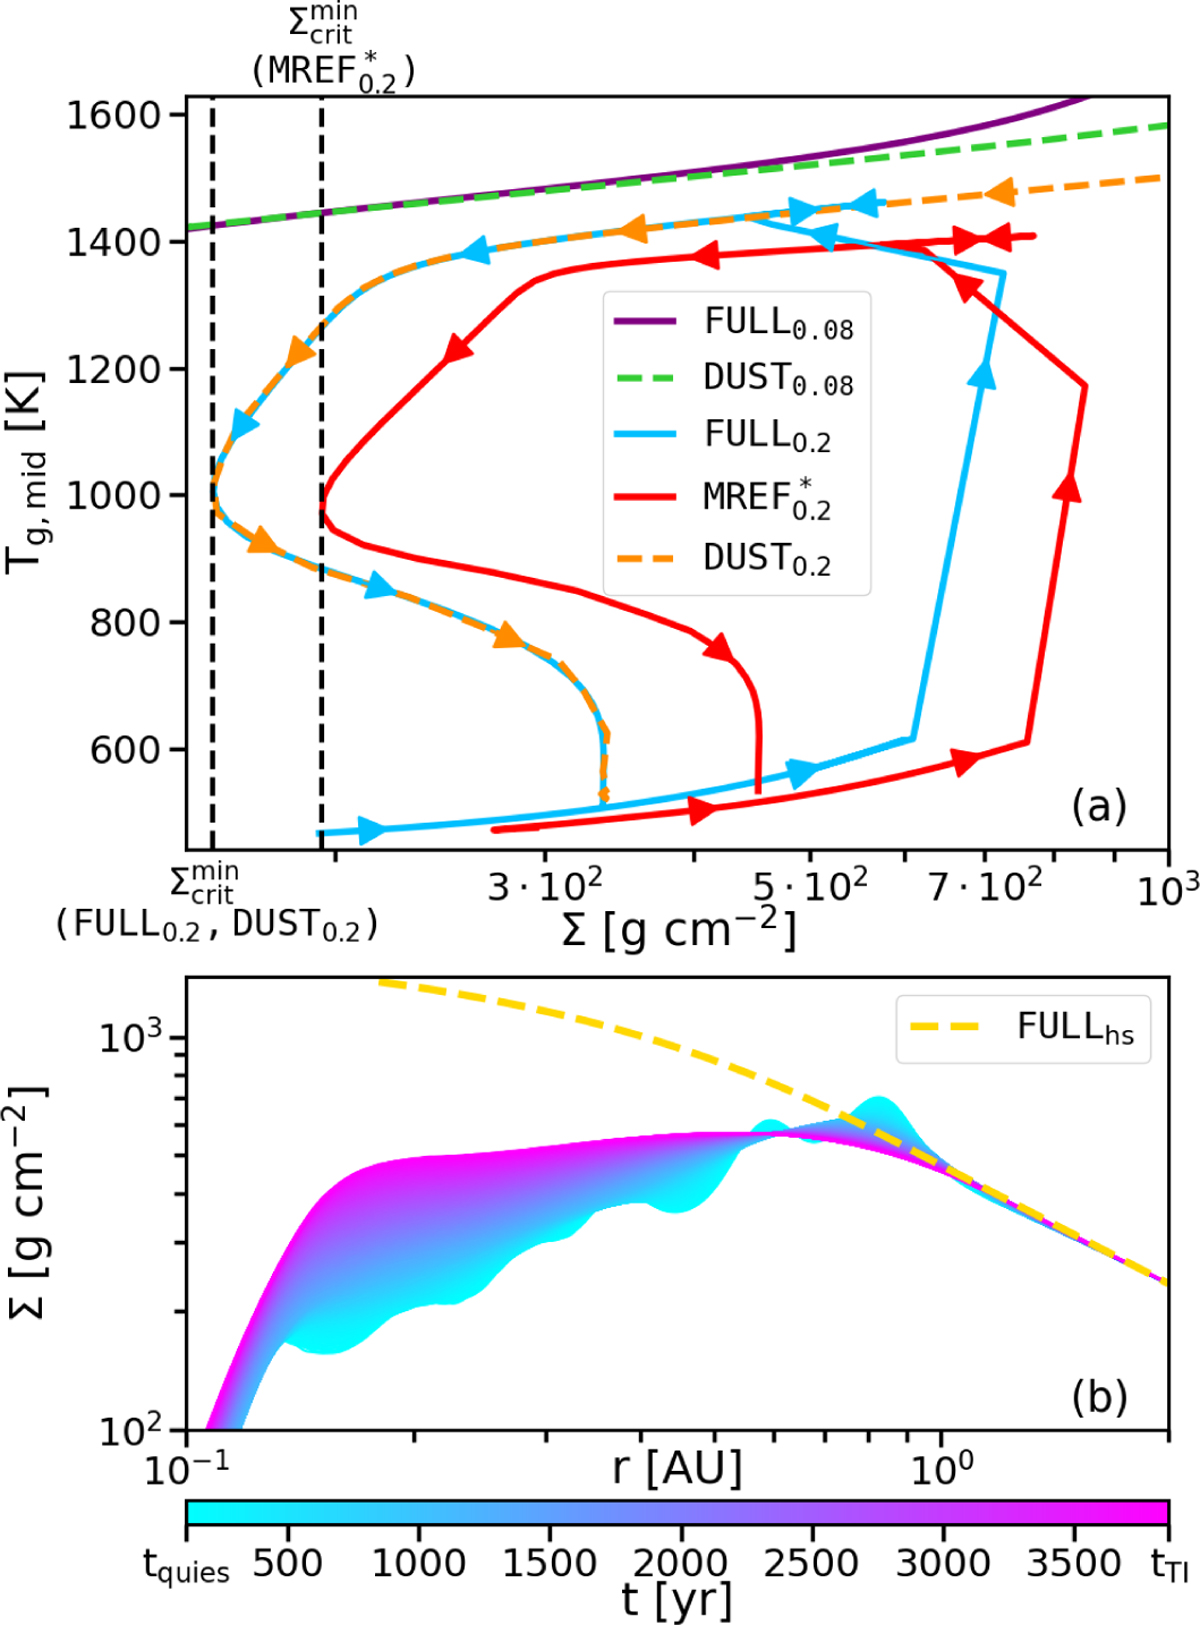
S-curve behaviour with respect to the MRI-activated TI and evolution of the inner disc during quiescence. Panel a: S-curves of MREF*, DUST, and FULL, extracted from the respective quiescent phases (for MREF* and FULL) compared with the main flares of the accretion events (for all three models) at a radius of 0.2 AU. The arrows along the curves indicate the direction of evolution. The dashed black lines mark the critical values of the surface densities at which the respective upper branches end. The panel also includes the upper branches of the S-curves for the DUST and FULL models at r = 0.08 AU. Panel b: evolution of the surface density during the quiescent phase of FULL. The dashed yellow line is the approximate profile of the hydrostatic structure the disc would adopt if no TI were to occur.
Current usage metrics show cumulative count of Article Views (full-text article views including HTML views, PDF and ePub downloads, according to the available data) and Abstracts Views on Vision4Press platform.
Data correspond to usage on the plateform after 2015. The current usage metrics is available 48-96 hours after online publication and is updated daily on week days.
Initial download of the metrics may take a while.