Fig. D.1
Download original image
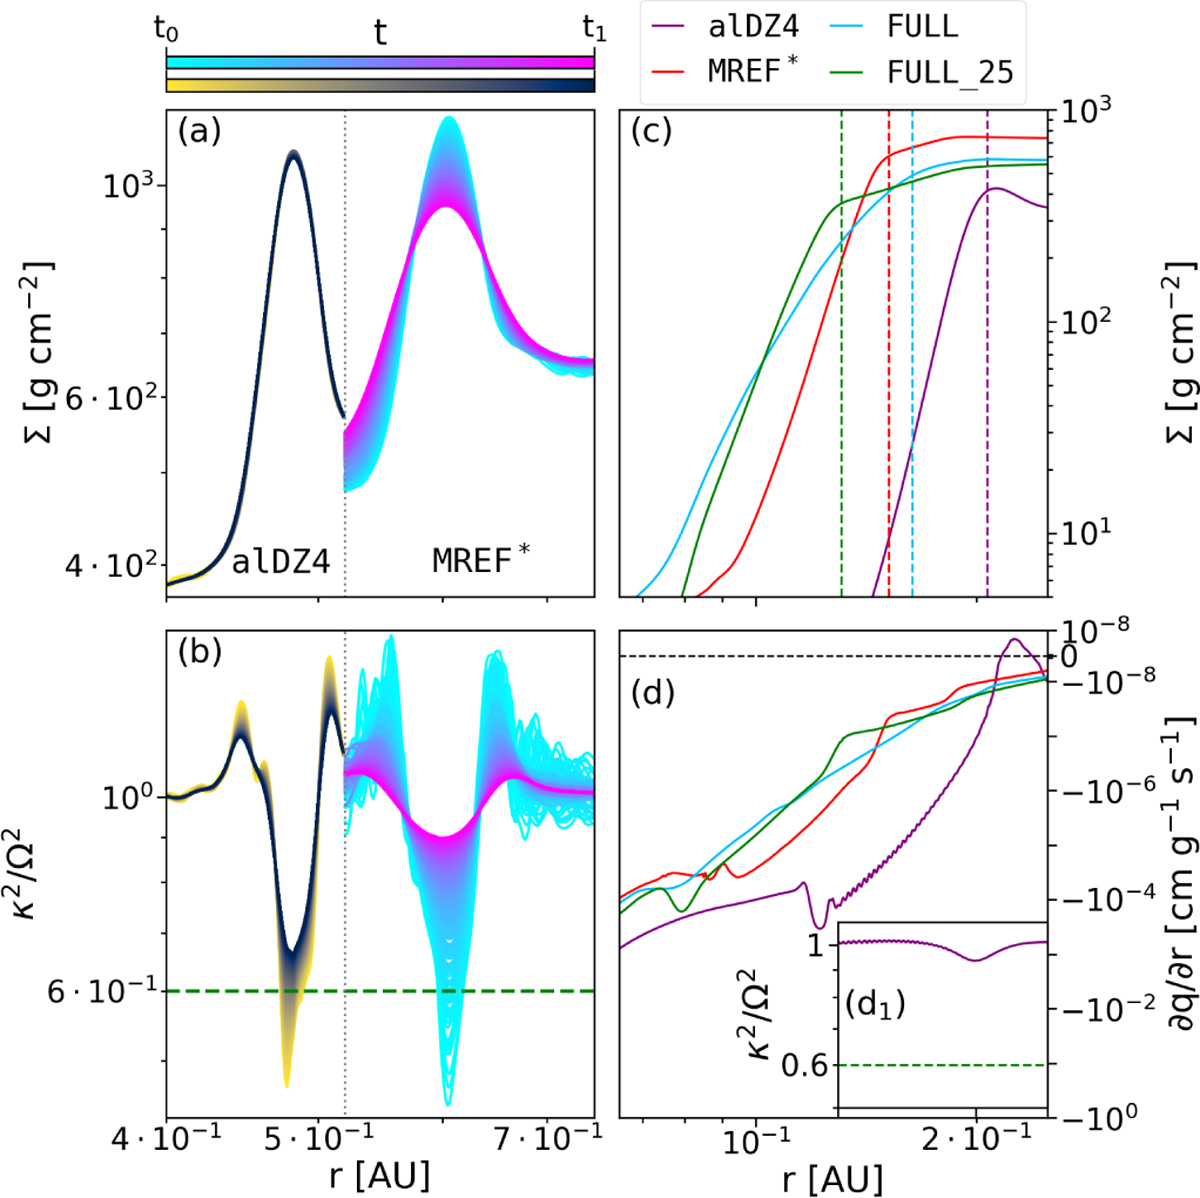
Effect of different viscosity parameters on the location and evolution of pressure bumps. Panels (a) and (b): Comparison between the models alDZ4 and MREF* (separated by the dotted grey line) in terms of the evolution of the surface density and κ2/Ω2 for a density bump placed by the respective outburst cycles. The depicted time frame is the same for both models and begins at a time t0 at which both models have roughly the same minimum value of κ2/Ω2. The time t1 = t0 + ∆t has been chosen arbitrarily. Panels (c) and (d): Surface density and the radial gradient of the vortensity for four different models in the radial range of the DZIE. The vertical dashed lines in panel (c) mark the positions of the inner pressure bumps in the respective models of the same colour. The inset panel (d1 ) presents κ2/Ω2 for the model alDZ4 around the position of the vortensity minimum. The dashed green lines in panels (b) and (d1) indicate the upper limit for the halfway-to-Rayleigh criterion.
Current usage metrics show cumulative count of Article Views (full-text article views including HTML views, PDF and ePub downloads, according to the available data) and Abstracts Views on Vision4Press platform.
Data correspond to usage on the plateform after 2015. The current usage metrics is available 48-96 hours after online publication and is updated daily on week days.
Initial download of the metrics may take a while.