Fig. F.1
Download original image
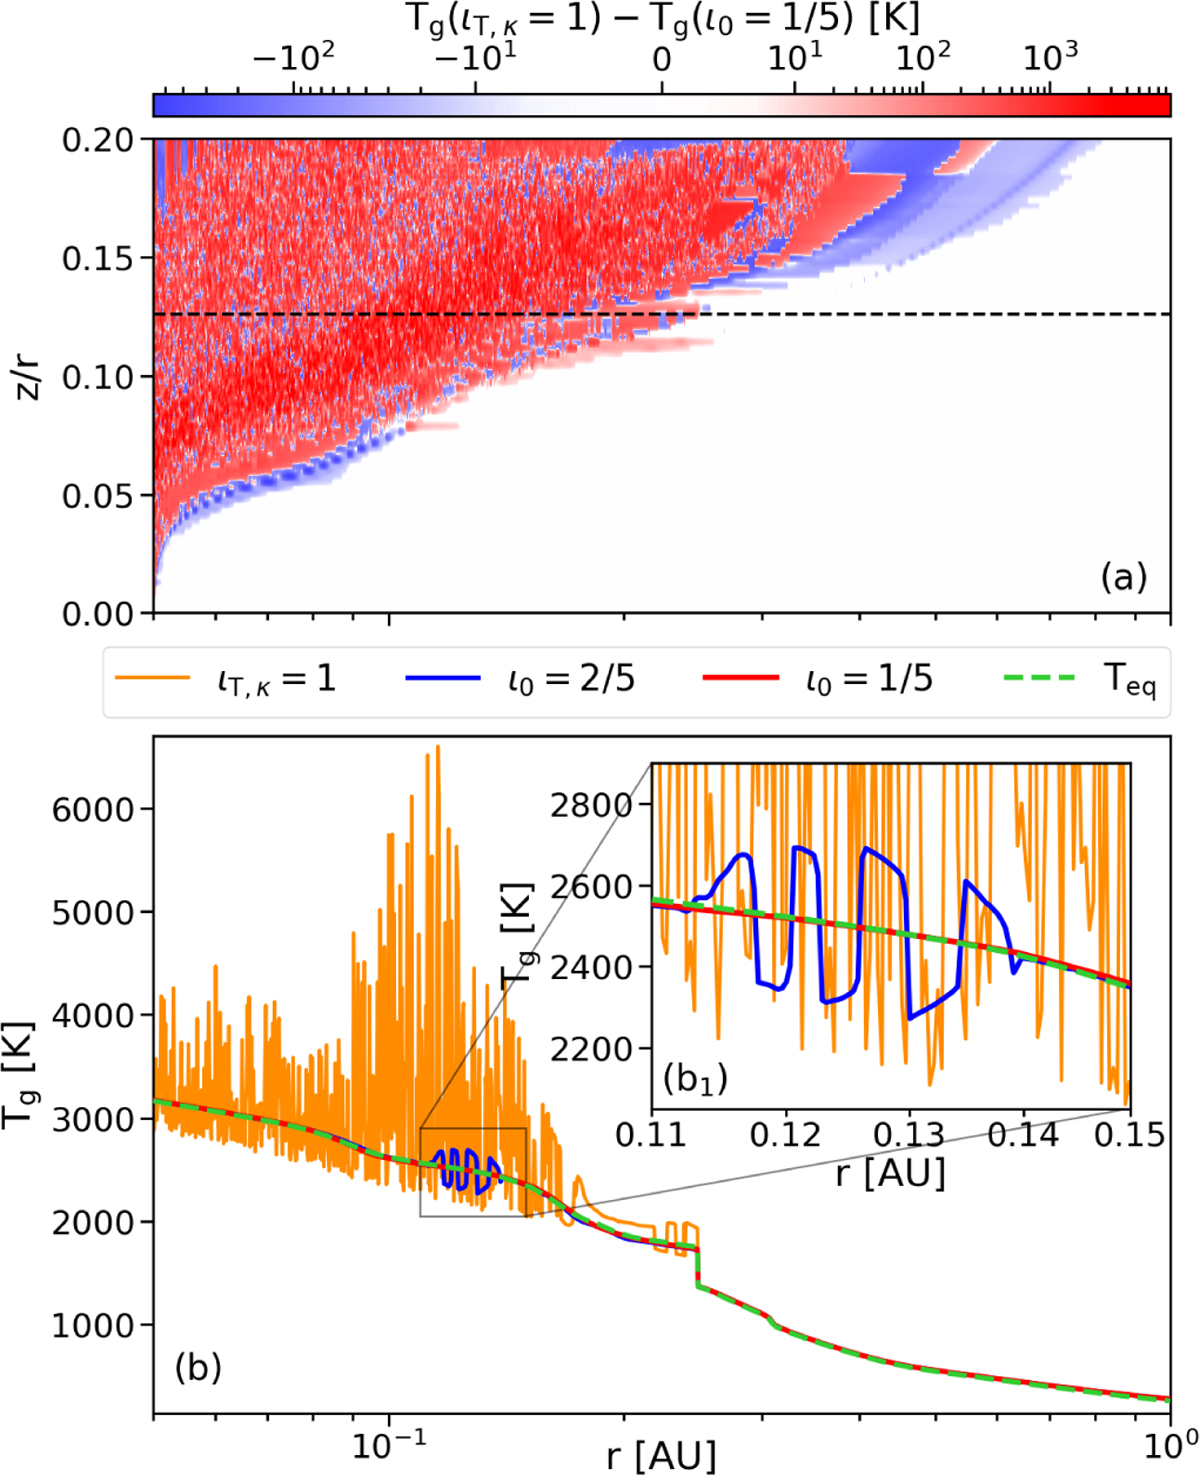
Visualisation of the effect of the under-relaxation scheme. Panel (a): Map of the temperature residuals between states calculated with (ι0 = 1/5) and without (ιT,κ = 1) under-relaxation for the upper hemisphere of the FULL model in quiescence. Radial temperature profiles for these two states have been extracted at a height of z/r = 0.125 (dashed black line) and are shown in panel (b). The blue curve represents an additional state resulting from a larger under-relaxation parameter ι0 = 2/5. The profile of the equilibrium temperature evaluated at every radius with Eq. (G.3) is shown as the dashed green line. Panel (b1): Magnification of the region where the more generous underrelaxation description still deviates from the equilibrium solution.
Current usage metrics show cumulative count of Article Views (full-text article views including HTML views, PDF and ePub downloads, according to the available data) and Abstracts Views on Vision4Press platform.
Data correspond to usage on the plateform after 2015. The current usage metrics is available 48-96 hours after online publication and is updated daily on week days.
Initial download of the metrics may take a while.