Fig. 2
Download original image
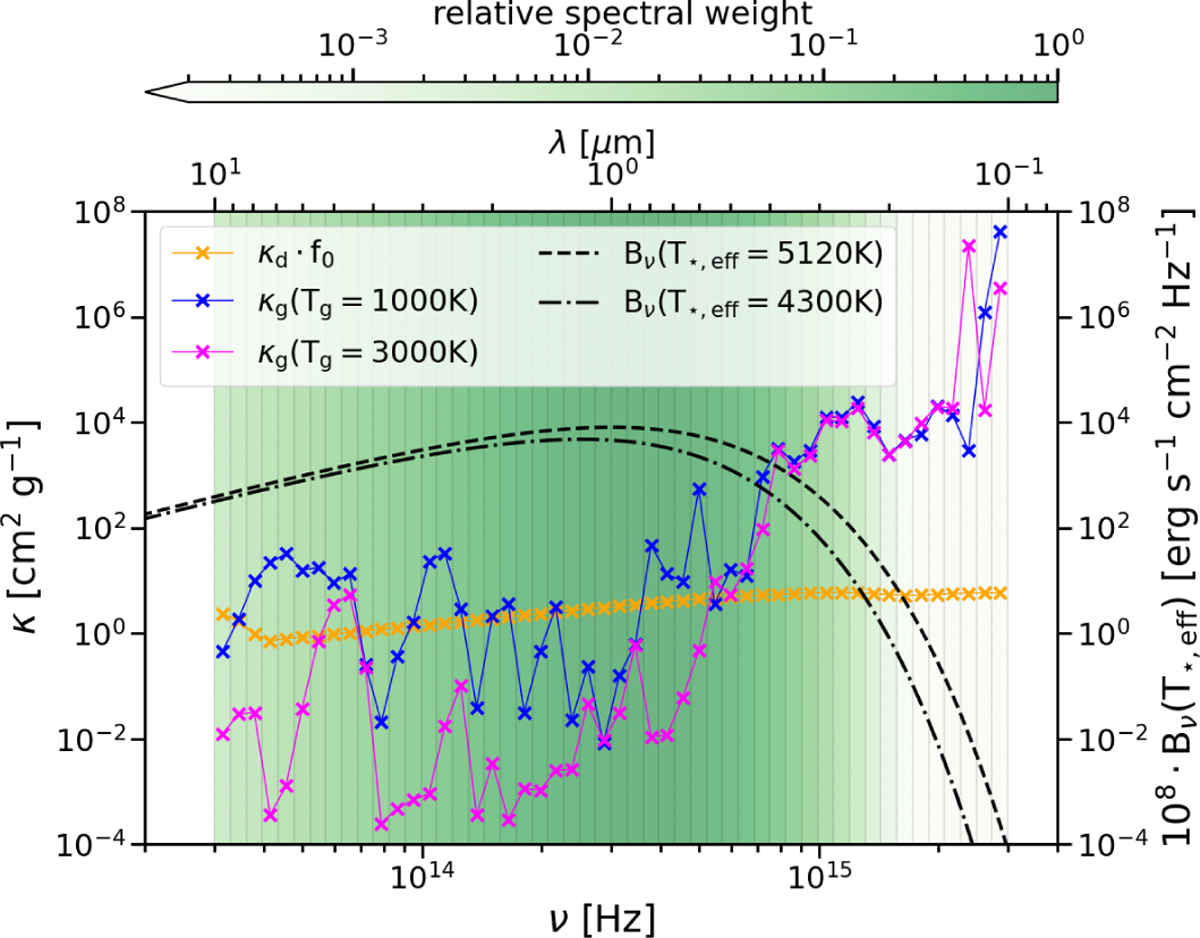
Frequency-dependent gas and dust opacities in relation to the irradiating blackbody spectrum of the central star. The black lines indicate the Planck function of the irradiation, where the dash-dotted line represents the star during the quiescent phase (with negligible contribution from the accretion luminosity), whereas the dashed line shows the irradiating spectrum that includes the effect of the maximum accretion luminosity occurring in our models. The separation of the frequency space into the 50 bins is indicated by the thin vertical lines, where each bin is coloured according to its relative spectral weight. The orange crosses mark the dust opacities in their respective bins, multiplied by the maximum dust-to-gas mass ratio f0. The gas opacities in each bin were evaluated for a density of 10−10 g cm−3 and are shown for two representative temperatures: 1000 K (blue crosses) and 3000 K (magenta crosses).
Current usage metrics show cumulative count of Article Views (full-text article views including HTML views, PDF and ePub downloads, according to the available data) and Abstracts Views on Vision4Press platform.
Data correspond to usage on the plateform after 2015. The current usage metrics is available 48-96 hours after online publication and is updated daily on week days.
Initial download of the metrics may take a while.