Fig. 3
Download original image
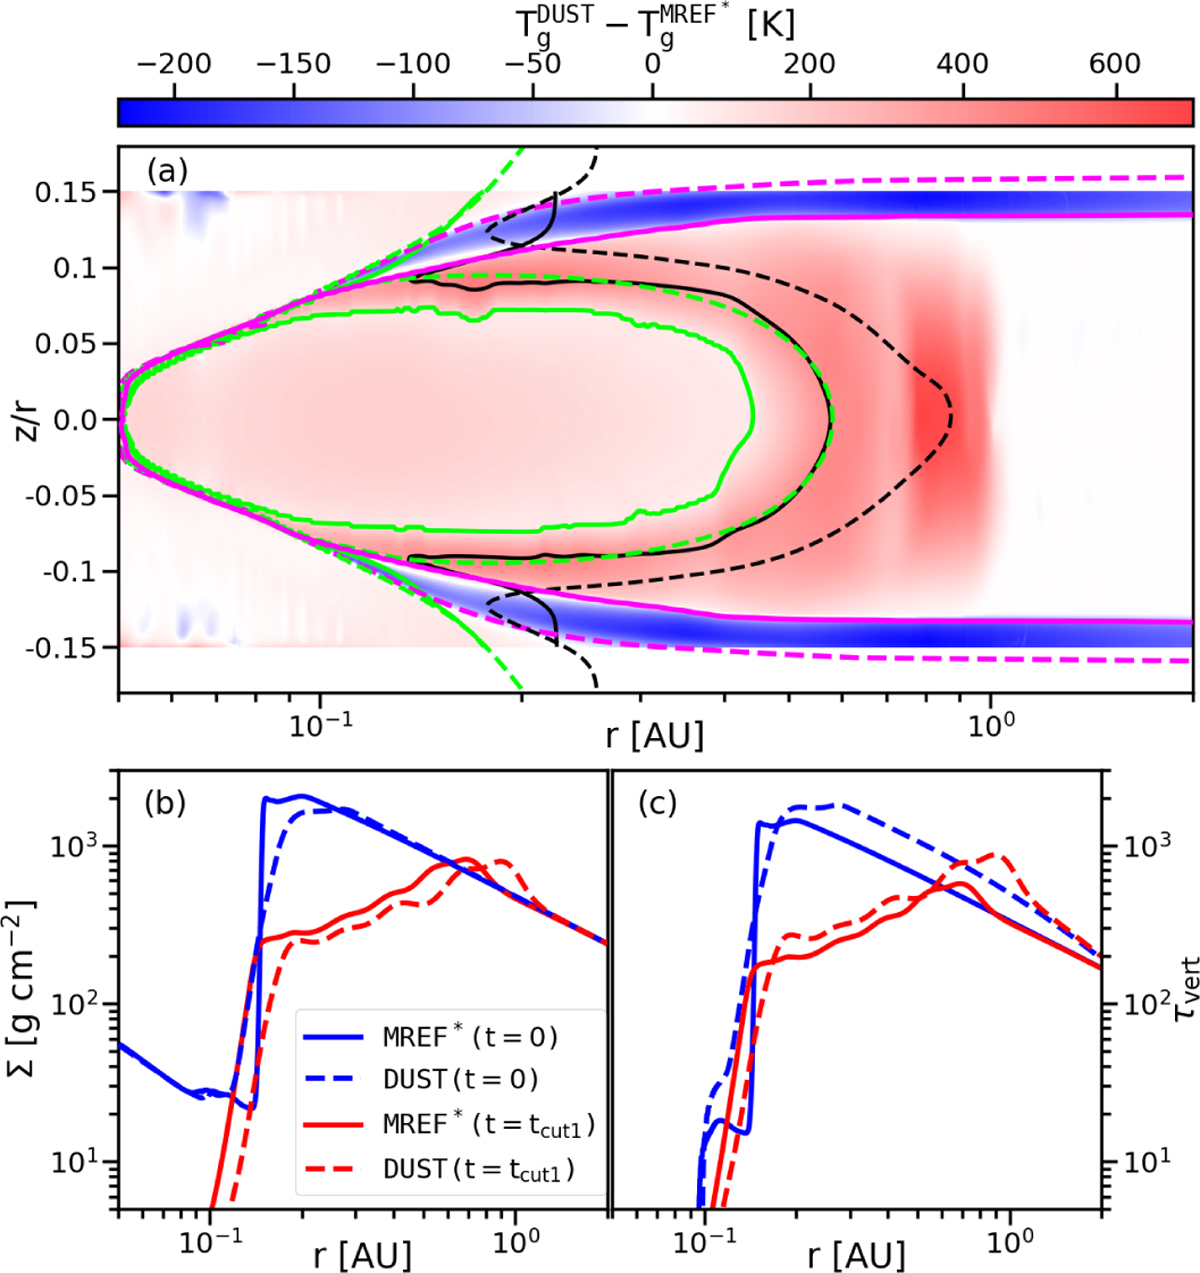
Comparison between the models MREF* and DUST. Panel a: map of the temperature difference between the two models at a stage when the MRI active region has reached its largest extent during a burst. The black, green, and magenta contour lines represent the MRI transition, the dust sublimation front, and the τrad = 1 surface, respectively, where the dashed lines correspond to DUST and the solid lines to MREF*. Panels b and c: surface density and total vertical optical depth, respectively, of both models at two different stages: the initial hydrostatic structure (blue), and the state after the initial burst, when most of the density bumps have diffused (red).
Current usage metrics show cumulative count of Article Views (full-text article views including HTML views, PDF and ePub downloads, according to the available data) and Abstracts Views on Vision4Press platform.
Data correspond to usage on the plateform after 2015. The current usage metrics is available 48-96 hours after online publication and is updated daily on week days.
Initial download of the metrics may take a while.