Fig. 5
Download original image
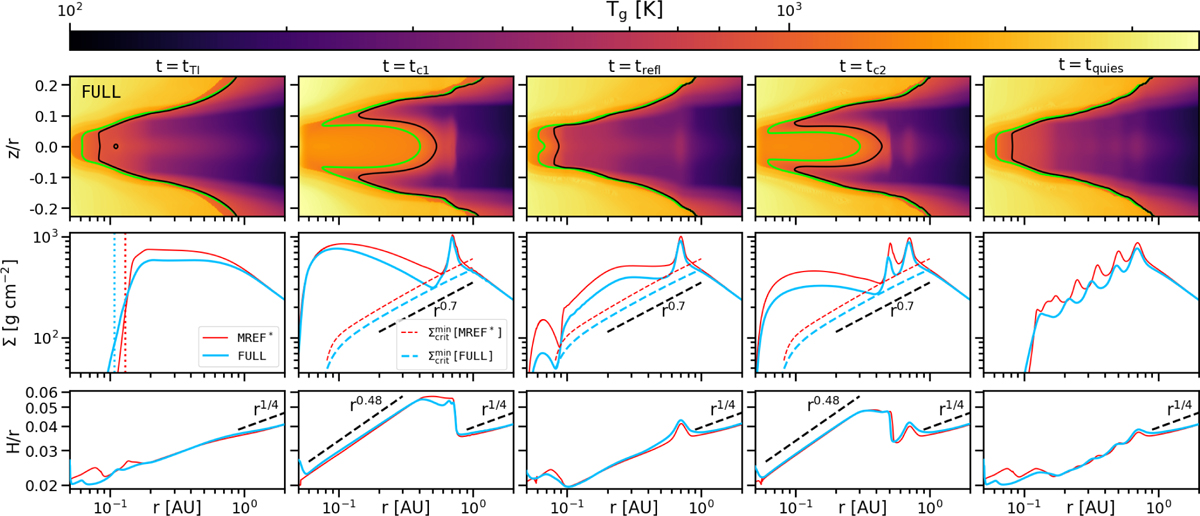
Evolution of the outburst in the FULL model compared to MREF*. The different columns correspond to different evolutionary stages, starting from the ignition of the burst at t = tTI, chronologically proceeding through the burst stage and ending with the beginning of the next quiescent state at t = tquies. The top row shows the temperature maps of FULL with the black and green contour lines marking the MRI-transition and the dust sublimation front. The middle row depicts the surface densities for both MREF* and FULL at the same stages during their respective evolution. The vertical dotted lines in the first panel indicate the locations of the DZIE in the corresponding model of the same colour. The panels in the second, third, and fourth column also show the respective profiles of ![]() together with a reference power-law profile of r0.7. The bottom row represents the aspect ratios H/r of both models. The r1/4 profile indicates the slope of H/r in the outer disc (>2 AU). In the high-state regions, an additional reference profile of r0.48 is shown.
together with a reference power-law profile of r0.7. The bottom row represents the aspect ratios H/r of both models. The r1/4 profile indicates the slope of H/r in the outer disc (>2 AU). In the high-state regions, an additional reference profile of r0.48 is shown.
Current usage metrics show cumulative count of Article Views (full-text article views including HTML views, PDF and ePub downloads, according to the available data) and Abstracts Views on Vision4Press platform.
Data correspond to usage on the plateform after 2015. The current usage metrics is available 48-96 hours after online publication and is updated daily on week days.
Initial download of the metrics may take a while.