Fig. 7
Download original image
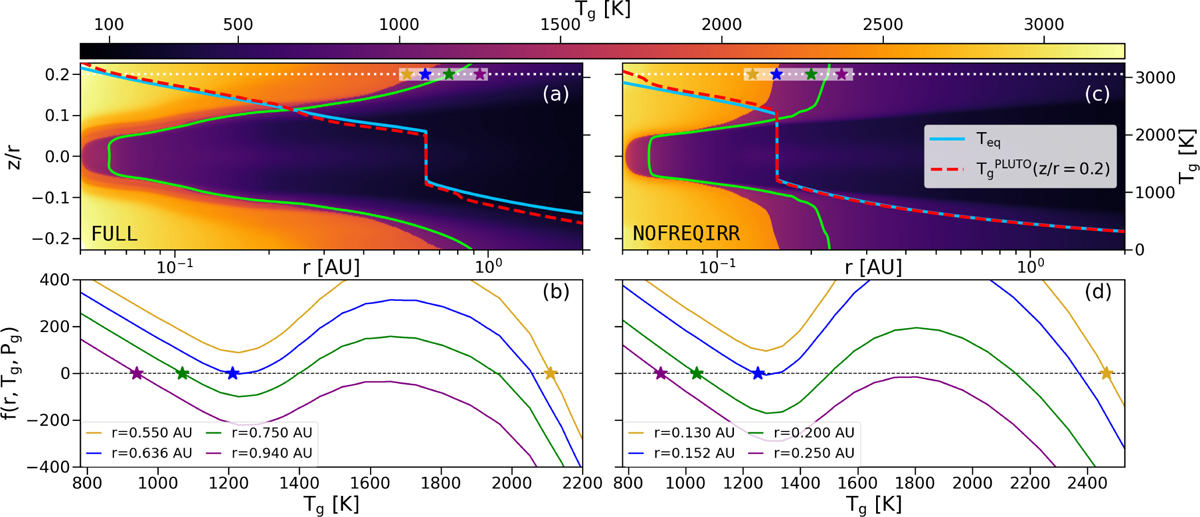
Temperature jump as a consequence of the equilibrium temperature degeneracy. Panels a and c: temperature maps of the quiescent phase for the models FULL and NOFREQIRR, respectively. The dashed red lines show the radial profiles of the temperatures at a height of z/r = 0.2 (indicated by the dotted white line). The solution of Eq. (G.3) for Teq at every radius is represented by the blue line. The green contours mark the dust sublimation fronts. Panels b and d: function given in Eq. (13), evaluated at four different radii for both models, respectively. The star-shaped markers indicate which of the available solutions is adopted by the solver at each radius. The same markers were used to locate the respective evaluation radii in panels a and c.
Current usage metrics show cumulative count of Article Views (full-text article views including HTML views, PDF and ePub downloads, according to the available data) and Abstracts Views on Vision4Press platform.
Data correspond to usage on the plateform after 2015. The current usage metrics is available 48-96 hours after online publication and is updated daily on week days.
Initial download of the metrics may take a while.