Fig. 8
Download original image
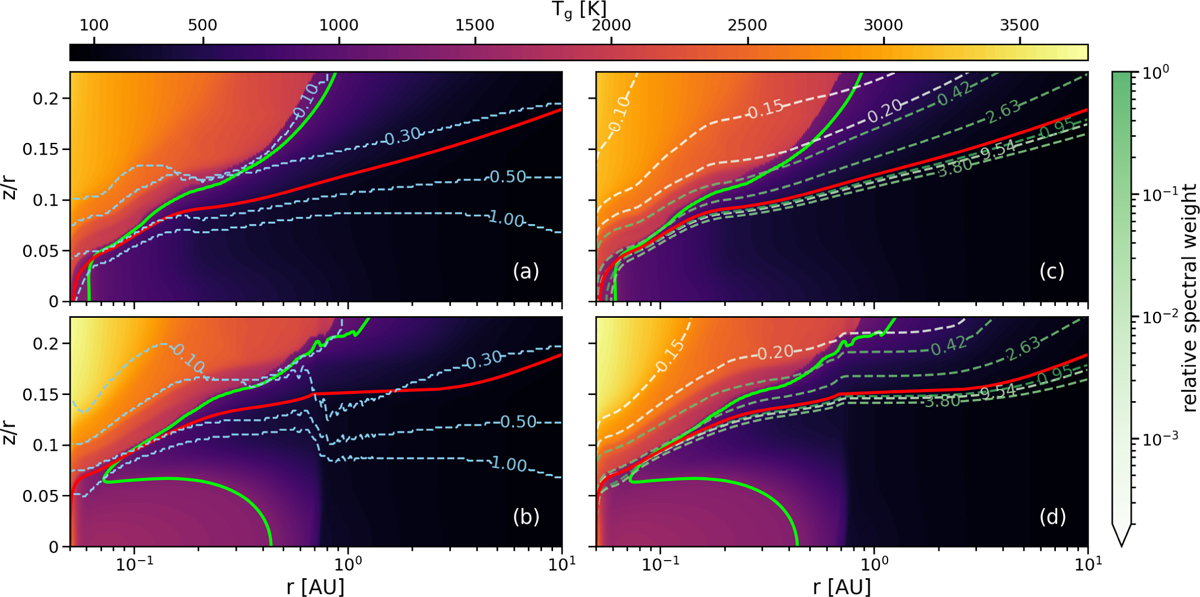
Different τ = 1 lines for a disc in quiescence (panels a and c) and in outburst (panels b and d) shown atop the underlying temperature structure for the model FULL. In panels a and b, the dashed blue lines mark the τvert(ν) = 1 surfaces for different wavelengths, which are indicated in the labels in units of μm. The dashed lines in panels c and d show the locations of the τrad(ν) = 1 transitions for the stellar irradiation for several representative wavelength bins with the respective central wavelengths in μm marked in the labels. The colour of the dashed lines indicates the relative spectral weight of the bin. Additionally, each panel includes the dust sublimation front as the green line and the τrad,tot = 1 line for the total radial optical depth in red.
Current usage metrics show cumulative count of Article Views (full-text article views including HTML views, PDF and ePub downloads, according to the available data) and Abstracts Views on Vision4Press platform.
Data correspond to usage on the plateform after 2015. The current usage metrics is available 48-96 hours after online publication and is updated daily on week days.
Initial download of the metrics may take a while.