Fig. 9
Download original image
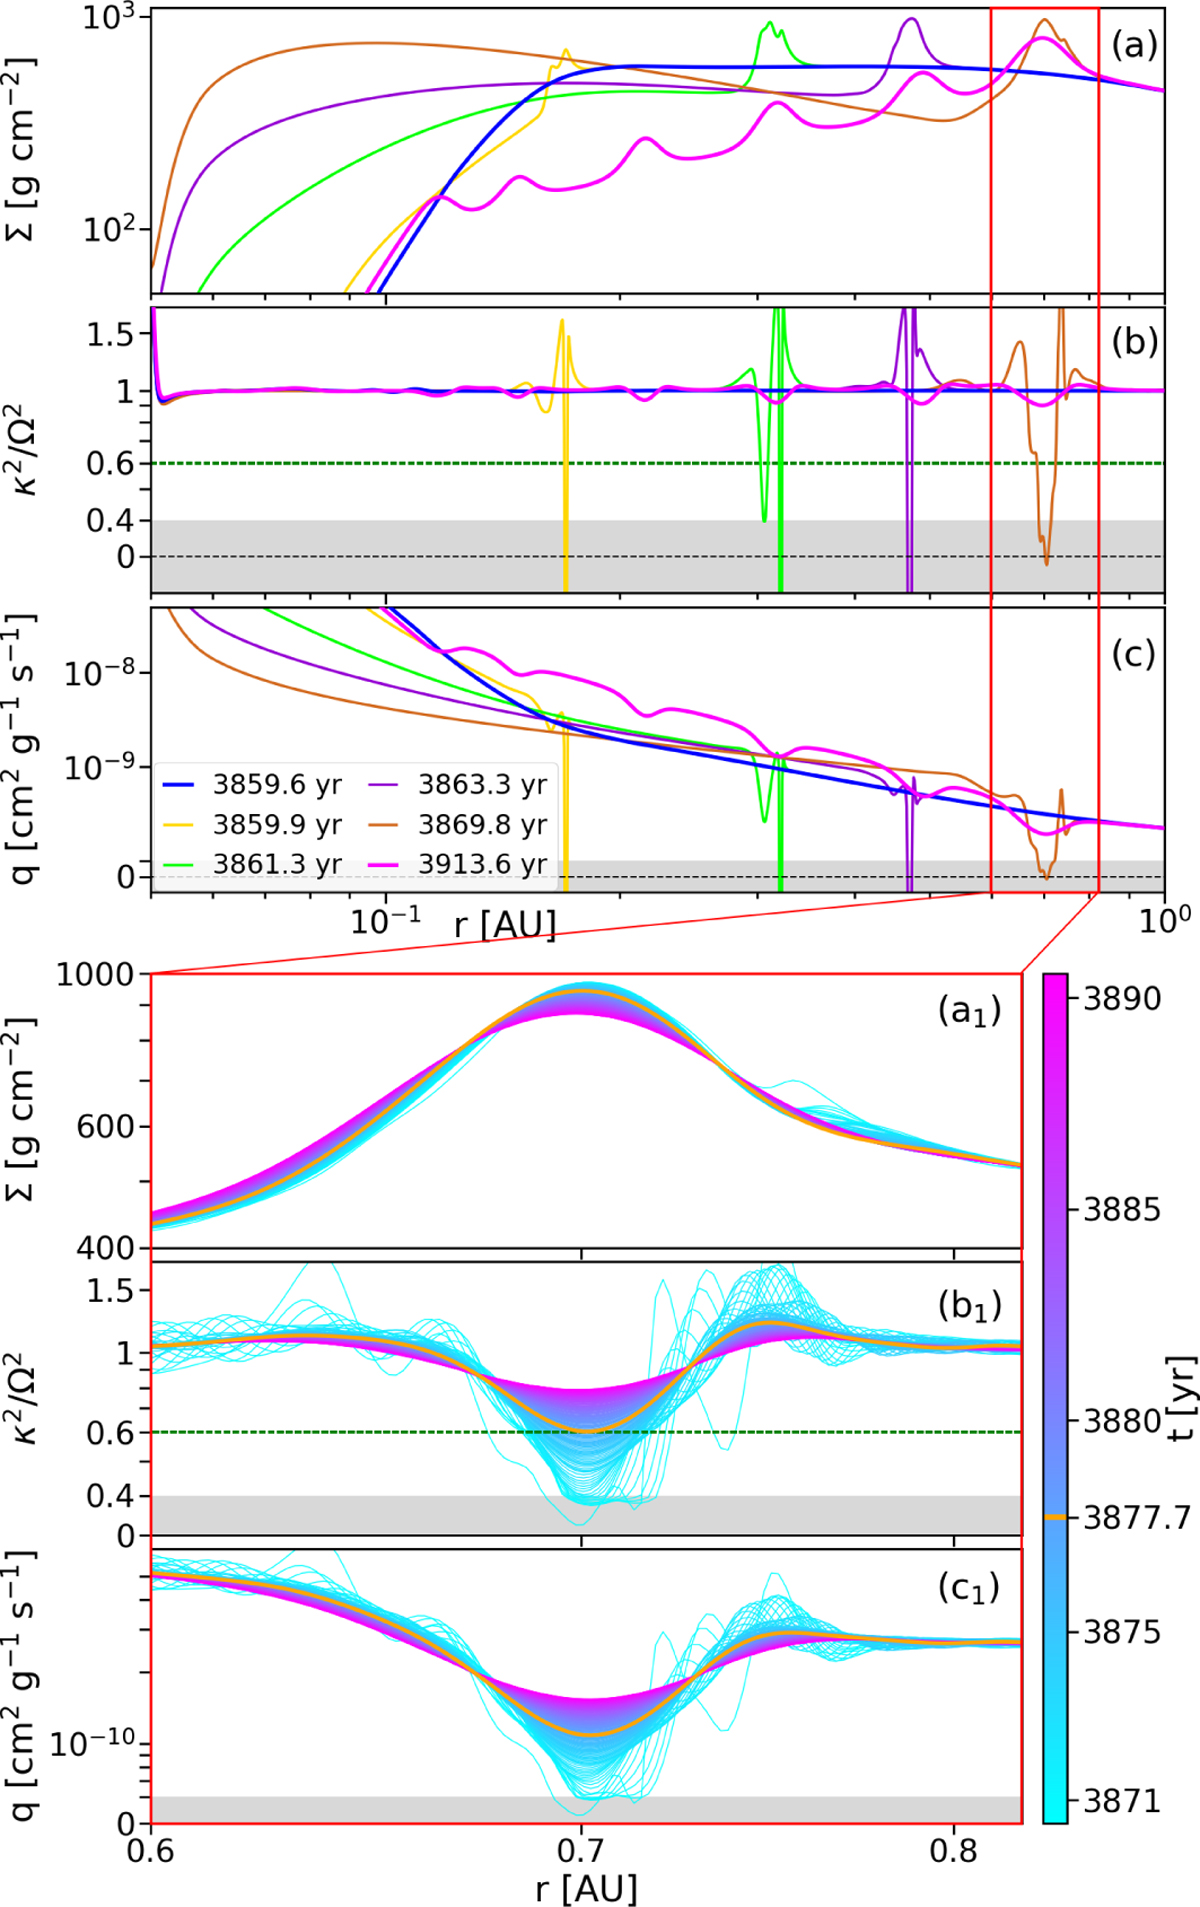
Analysis of the stability criteria for the density maxima generated during the outburst in the FULL model. Top three panels: temporal evolution of the surface density Σ (panel a), the parameter κ2/Ω2 (panel b), and the vortensity q (panel c). These are shown as snapshots during the time frame starting from the ignition of the burst (t = tTI, blue line) until the first density bump has reached its outermost position and κ2/Ω2 becomes positive (brown line). Additionally, the pink line represents the disc at t = tquies. The dashed green line in panels b and (b1) indicates the halfway-to-Rayleigh stability threshold. Bottom three panels: Same three quantities, but zoomed into the radial region where the first density bump is located. The colour-coded time frame begins at the moment when min(κ2/Ω2) > 0 and includes the transition from instability to stability according to the halfway-to-Rayleigh criterion, reached at t = 3877.7 yr (orange line in panels a1, b1, and c1 and in the colour bar). Quantities in panel b, (b1), panel c, and (c1) are depicted on a logarithmic scale with a linear transition around zero, indicated by the grey shaded region.
Current usage metrics show cumulative count of Article Views (full-text article views including HTML views, PDF and ePub downloads, according to the available data) and Abstracts Views on Vision4Press platform.
Data correspond to usage on the plateform after 2015. The current usage metrics is available 48-96 hours after online publication and is updated daily on week days.
Initial download of the metrics may take a while.