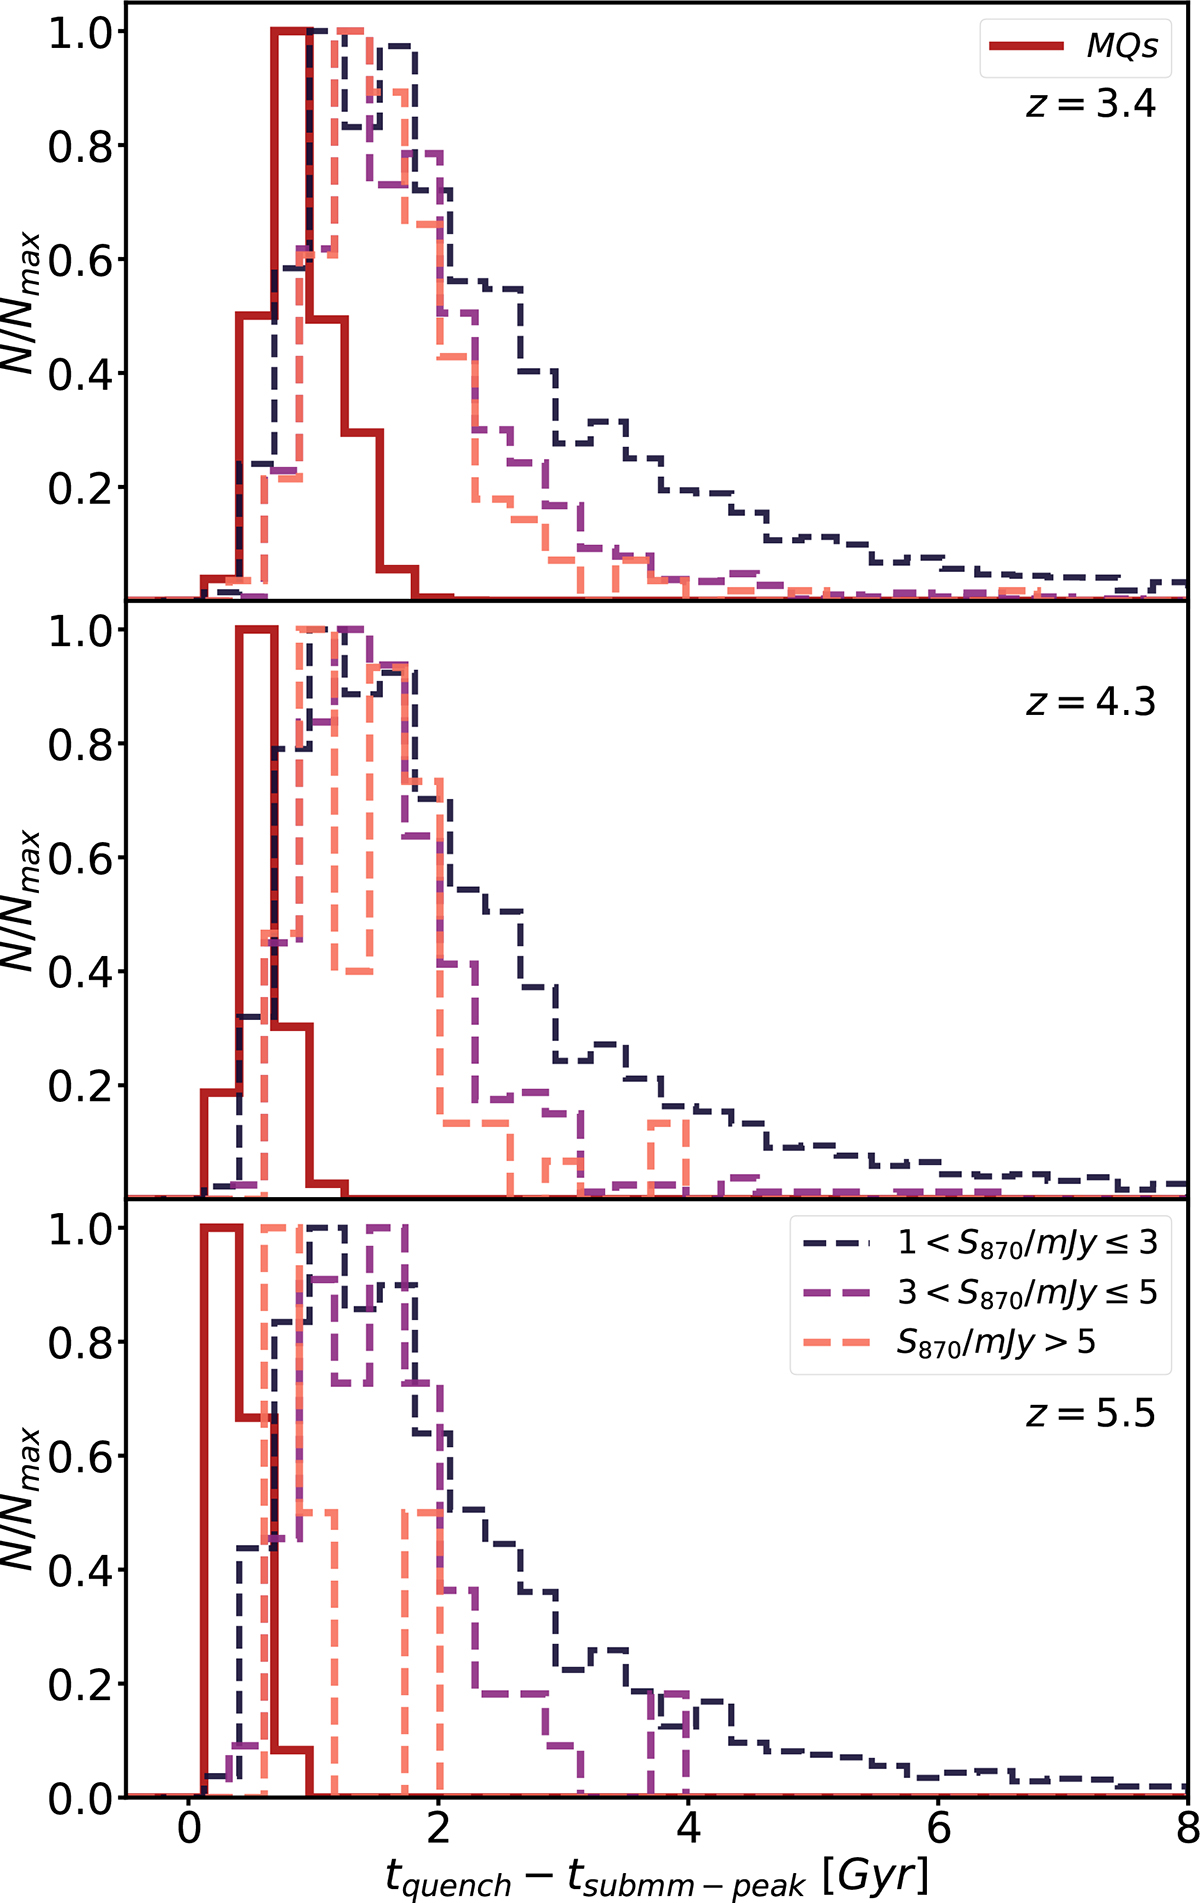
Fig. 10.
Download original image
Distribution of timescales between the sub-millimetre peak (S870, max) and subsequent quenching is shown for massive quiescent (MQ) progenitors (solid red histogram), and for faint (dark blue dashed), intermediate (purple dashed), and bright (orange dashed) dusty star-forming galaxies (DSFGs) selected at z = 3.4 (first panel), 4.3 (second panel), and 5.5 (third panel), the typical redshifts at which MQs at z = 2, 3, and 4, respectively, were in a DSFG phase. The timescale distributions for DSFGs exhibit similar peaks, although faint DSFGs show greater dispersion, with tails towards longer timescales. At z = 5.5, bright DSFGs present shorter timescales than their analogues at lower redshifts. MQ progenitors show systematically shorter timescales than DSFGs, with durations increasing for MQs selected at lower redshifts. A zoomed-in version of the MQ timescale distribution is shown in Figure B.1.
Current usage metrics show cumulative count of Article Views (full-text article views including HTML views, PDF and ePub downloads, according to the available data) and Abstracts Views on Vision4Press platform.
Data correspond to usage on the plateform after 2015. The current usage metrics is available 48-96 hours after online publication and is updated daily on week days.
Initial download of the metrics may take a while.