| Issue |
A&A
Volume 707, March 2026
|
|
|---|---|---|
| Article Number | A305 | |
| Number of page(s) | 15 | |
| Section | Extragalactic astronomy | |
| DOI | https://doi.org/10.1051/0004-6361/202557426 | |
| Published online | 13 March 2026 | |
The connection between dusty star-forming galaxies and the first massive quenched galaxies
1
Cosmic Dawn Center (DAWN), Copenhagen, Denmark
2
DTU Space, Technical University of Denmark, Elektrovej 327, DK2800 Kgs. Lyngby, Denmark
3
Departamento de Astronomia, Instituto de Astronomia, Geofísica e Ciências Atmosféricas, Universidade de São Paulo, Rua do Matão 1226, Cidade Universitária, 05508-900 São Paulo, SP, Brazil
4
Jodrell Bank Centre for Astrophysics, University of Manchester, Oxford Road, Manchester M13 9PL, UK
5
Centre for Astrophysics Research, University of Hertfordshire, Hatfield AL10 9AB, UK
6
J.P. Morgan Securities LLC, 390 Madison Avenue New York, NY 10017, USA
7
Leiden Observatory, Leiden University, PO Box 9513, NL-2300 RA Leiden, The Netherlands
★ Corresponding author: This email address is being protected from spambots. You need JavaScript enabled to view it.
Received:
26
September
2025
Accepted:
5
February
2026
Abstract
High-redshift (z ≳ 2) massive quiescent galaxies (MQs) provide an opportunity to probe the key physical processes driving the fuelling and quenching of star formation in the early Universe. Observational evidence suggests a possible evolutionary link between MQs and dusty star-forming galaxies (DSFGs, or sub-millimetre galaxies), another extreme high-redshift population. However, galaxy formation models have historically struggled to reproduce these populations–especially simultaneously–limiting our understanding of their formation and connection, particularly in light of recent JWST findings. In previous work we presented a recalibrated version of the L-Galaxies semi-analytic model that provides an improved match to observationally inferred number densities of both DSFG and MQ populations. For this work we used this new model to investigate the progenitors of MQs at z > 2 and the physical mechanisms that lead to their quenching. We find that most MQs at z > 2 were sub-millimetre-bright (S870 ≳ 1 mJy) at some point in their cosmic past. The stellar mass of MQs is strongly correlated with the maximum sub-millimetre flux density attained over their history, and this relation appears to be independent of redshift. However, only a minority of high-redshift DSFGs evolve into MQs by z = 2. The key distinction between typical DSFGs and MQ progenitors lies in their merger histories: MQ progenitors experience an early major merger that triggers a brief, intense starburst and rapid black hole growth, depleting their cold gas reservoirs. In our model, active galactic nucleus (AGN) feedback subsequently prevents further gas cooling, resulting in quenching. In contrast, the broader DSFG population remains sub-millimetre-bright; star formation proceeds primarily via secular processes, and becomes quenched later. These findings provide a coherent theoretical framework for the formation of high-redshift MQs and clarify their connection to DSFGs, highlighting the role of mergers and AGN feedback in shaping the evolution of the most massive galaxies in the early Universe.
Key words: methods: numerical / galaxies: evolution / galaxies: high-redshift / galaxies: starburst / submillimeter: galaxies
© The Authors 2026
 Open Access article, published by EDP Sciences, under the terms of the Creative Commons Attribution License (https://creativecommons.org/licenses/by/4.0), which permits unrestricted use, distribution, and reproduction in any medium, provided the original work is properly cited.
This article is published in open access under the Subscribe to Open model. This email address is being protected from spambots. You need JavaScript enabled to view it. to support open access publication.
1. Introduction
In recent years, the identification of numerous massive quiescent galaxies – typically defined by a high stellar mass (M★ ≳ 1010.5 M⊙) and a low specific star formation rate (sSFR ≲ 10−10 yr−1) – at high redshift (z ≳ 2) has posed significant challenges to existing theoretical models of galaxy formation and evolution. Early efforts using deep photometric data, such as those from the FourStar Galaxy Evolution (ZFOURGE) survey, suggested the presence of such galaxies at z ≳ 3 prior to the peak of the cosmic star formation rate density and the peak of the cosmic merger rate density (Fontana et al. 2009; Spitler et al. 2014; Straatman et al. 2014). These initial MQ candidates were selected based on red rest-frame optical colours (indicative of Balmer breaks) derived from spectral energy distribution (SED) fitting, alongside dropout techniques (e.g. the Lyman break). Subsequent spectroscopic confirmations have enabled more robust characterisations of MQs (e.g. Glazebrook et al. 2017; Schreiber et al. 2018; Tanaka et al. 2019; D’Eugenio et al. 2020; Forrest et al. 2020; Valentino et al. 2020; Kubo et al. 2021; Nanayakkara et al. 2022), an effort extended to fainter redder galaxies with the advent of JWST (Carnall et al. 2023a; Valentino et al. 2023; Carnall et al. 2024; Nanayakkara et al. 2024; Alberts et al. 2024; Glazebrook et al. 2024; Long et al. 2024; Park et al. 2024; Baker et al. 2025; Nanayakkara et al. 2025). These observations suggest that MQs formed through intense short-lived starbursts, with a ∼500 M⊙ yr−1 star formation rate (SFR), that occurred within the first ≲1 Gyr of cosmic time, whose star formation episodes lasted ∼600 Myr (Glazebrook et al. 2017; Forrest et al. 2020; Carnall et al. 2023a). The high inferred past star formation rates suggest a potential evolutionary connection with dusty star-forming galaxies (DSFGs) at higher redshifts. Other statistical properties, such as their typical number densities (Valentino et al. 2020) and host halo masses inferred from clustering analyses (e.g. Wilkinson et al. 2017), also support a connection between these populations.
The mechanisms driving the early quenching of high-redshift MQs remain unclear. X-ray and radio emission have been detected in a sub-set of MQs (Marsan et al. 2017; Ito et al. 2022; Kubo et al. 2022). Notably, MQs tend to host stronger active galactic nucleus (AGN) activity (as indicated by both X-ray and radio luminosities) than star-forming galaxies of similar stellar mass, whose relative excess increases with redshift (Ito et al. 2022). This supports the view that AGN feedback may be the dominant quenching mechanism for MQs at z ≳ 3. On the other hand, other studies (e.g. Ellison et al. 2022, 2024; Calderón-Castillo & Smith 2024; Gordon et al. 2026) suggest that mergers primarily deplete galaxies’ cold-gas reservoirs through intense starburst episodes rather than AGN-driven feedback. However, the relatively short detectability timescales of AGN (Δt ∼ 105 yr; Schawinski et al. 2015) may result in the underestimation of the true prevalence of recent AGN activity in quenching galaxies. MQs have also been identified in protocluster environments at z ∼ 3; the results of Kubo et al. (2021), McConachie et al. (2022), and Ito et al. (2023) support a scenario in which these galaxies quenched due to accelerated internal evolution, such as elevated SFRs combined with AGN and/or supernova (SN) feedback, rather than explicit environmental effects such as ram pressure stripping. In contrast, Shi et al. (2021) reported evidence for environmental quenching in the D4UD01 protocluster at z = 3.24, suggesting that multiple quenching pathways may coexist.
While MQs are rare, with number densities of ∼10−5 Mpc−3 at z ∼ 3.5 (Schreiber et al. 2018; Straatman et al. 2014; Merlin et al. 2019) (though estimates vary significantly between studies; see the compilation presented by Valentino et al. 2023), their number densities at high redshift are in tension with predictions from most current galaxy formation models. Accurately reproducing the observed abundance of MQs at z ≳ 3 at the same time as matching low-redshift constraints has proven particularly challenging; this tension has only been exacerbated by recent JWST results that suggest an even more abundant MQ population than was inferred pre-JWST. A recent systematic comparison by Lagos et al. (2025) assessed the success of various semi-analytic models (SAMs)–including GAEA (De Lucia et al. 2024), GALFORM (Lacey et al. 2016), and SHARK v2.0 (Lagos et al. 2024)–as well as hydrodynamical simulations such as SIMBA, IllustrisTNG, and EAGLE, in reproducing the number densities of MQs at z ≳ 3. Lagos et al. (2025) showed that most of these models underpredict the observationally inferred MQ number densities at z ∼ 4, by between 0.3 dex and more than an order of magnitude. Similar discrepancies have been reported by other groups; for example, Szpila et al. (2025) used the SIMBA-C simulation (Hough et al. 2023, 2024), and Vani et al. (2025) used an updated version of the L-Galaxies SAM (Ayromlou et al. 2021). On the other hand, the observed number densities of MQs at high redshift could be significantly contaminated, for example by dusty galaxies or little red dots (Yang et al. 2025), a population of compact, presumably AGN-dominated sources (Labbé et al. 2023; Greene et al. 2024; Matthee et al. 2024; Li et al. 2025), recently uncovered by JWST observations.
While some models succeed in broadly reproducing observationally inferred number densities of MQs, those that do typically struggle with the sub-millimetre galaxy number counts. For instance, although the IllustrisTNG simulation yields reasonably accurate predictions for MQ number densities (Lagos et al. 2025), it significantly underpredicts sub-millimetre galaxy number counts (Hayward et al. 2021). A similar situation is seen with the EAGLE simulation, which also matches MQ number densities at high redshift. However, as shown by Cowley et al. (2019), who modelled sub-millimetre emission using the SKIRT radiative transfer code, the predicted sub-millimetre counts fall more than an order of magnitude below observational estimates (see also McAlpine et al. 2019).
The inverse trend is found in models that successfully reproduce the sub-millimetre number counts. For example, Lagos et al. (2019) demonstrated that the Lagos et al. (2018) (v1.0) version of SHARK matches observed sub-millimetre number counts without requiring modification of the stellar initial mass function (IMF). However, this version underpredicts the MQ number densities at z ≳ 2 by roughly 1 dex compared to the updated v2.0 release (Lagos et al. 2024), which better matches the lower limits of observational estimates. A similar outcome is seen with the original Illustris simulation, which performs well in reproducing sub-millimetre number counts (Hayward et al. 2021) yet significantly underestimates the abundance of quiescent galaxies (Merlin et al. 2019). Although SIMBA predicts a higher number density of MQs than Illustris, it still falls short of matching observed abundances. At the same time, SIMBA achieves a good match to sub-millimetre number counts (Lovell et al. 2021).
This trend–where models that reproduce MQs at high redshift tend to underpredict DSFGs, and vice versa–reveals a persistent tension in galaxy formation models. It suggests that the physical mechanisms required for efficient dust-obscured starbursts may be at odds with those needed for rapid quenching and MQ formation. Since observational evidence points towards an evolutionary connection between DSFGs and MQs (Daddi et al. 2010; Tacconi et al. 2010; Toft et al. 2014; Casey et al. 2014; Valentino et al. 2020; Forrest et al. 2020), simulations could offer a powerful framework for exploring this link. However, due to the aforementioned inconsistencies, this connection remains poorly studied from a theoretical perspective.
Recently, Araya-Araya et al. (2025), through the application of a robust calibration method to the Henriques et al. (2020) version of L-Galaxies, tested a range of observational constraints aimed at reconciling the simultaneous modelling of MQs and DSFGs. Among nine alternative configurations, one model was found to reproduce both populations reasonably well. In this context, the recalibrated version of L-Galaxies presented by Araya-Araya et al. (2025) provides a unique opportunity to explore the proposed connection between high-redshift MQs and DSFGs. For this work, we used the Araya-Araya et al. (2025) model initially labelled ‘no HIMF’1 to investigate this observationally motivated connection. In particular, we focused on identifying the progenitors of MQs at z = 2, 3, and 4, and investigating the primary physical mechanisms responsible for transforming these progenitors into massive quiescent galaxies by these early epochs.
The structure of this paper is as follows. In Section 2 we provide a brief overview of the Henriques et al. (2020) version of the L-Galaxies SAM and the recalibrated model introduced by Araya-Araya et al. (2025). Our results are presented in Section 3. In Section 4 we discuss our main findings. Finally, we summarise our conclusions in Section 5.
In this work we adopt the Planck Collaboration XVI (2014) cosmology, σ8 = 0.829, H0 = 67.3 km s−1 Mpc−1, ΩΛ = 0.685, Ωm = 0.315, Ωb = 0.0487, fb = 0.155, and n = 0.96, consistent with the cosmologically rescaled version of the Millennium simulation (Angulo & Hilbert 2015). Throughout this study, we assume a Chabrier (2003) IMF.
2. Galaxy formation model
We use the Henriques et al. (2020) version of the L-Galaxies semi-analytical model (SAM) of galaxy formation, specifically the recalibrated version from Araya-Araya et al. (2025). We run the model on the Millennium simulation (Springel 2005), scaled to the Planck Collaboration XVI (2014) cosmology using the method from Angulo & Hilbert (2015). This scaled version of the Millennium simulation has a total box volume of (713.6 cMpc)3 and a dark matter particle mass resolution of mp = 1.43 × 10⁹ M⊙ (h = 0.673, in Planck Collaboration XVI 2014 cosmology). In this section, we describe the key features of the galaxy formation model.
The merger trees of dark matter halos, constructed with the SUBFIND algorithm (Springel et al. 2001), form the backbone of L-Galaxies. These virialised halos are populated with baryonic matter, beginning with primordial diffuse gas. Initially, the gas infalls into the halos, forming a hot atmosphere. Upon cooling, this gas settles into a disk, where it becomes available for star formation, regulated by the surface density of molecular hydrogen (H2). Over time, stars die and release energy, enriching the interstellar medium (ISM) and circumgalactic medium (CGM) with metals. The energy from supernovae (SNe) can (1) heat the cold gas in the disk, moving it to hot atmosphere, available for further cooling, and (2) drive outflows that move gas to an external reservoir, from which it may later reaccrete. The Henriques et al. (2020) version of the model also includes metal enrichment from AGB stars, as well as from SN-Ia and SN-II events. All these processes are tracked in concentric rings within galaxies.
Galaxy mergers are key astrophysical events that can trigger starbursts, destroy disks, form or enhance bulges, drive the growth of supermassive black holes (SMBHs), and power AGN feedback – a critical mechanism for regulating star formation in massive galaxies. Environmental effects, such as ram pressure stripping, tidal stripping, and tidal disruption, are also modelled when a halo is accreted by a more massive one. These processes can strip hot gas, modify morphology, or even disperse the stars from the infalling galaxy into the stellar halo.
All of these processes are described by differential equations involving free parameters, which have been robustly calibrated using MCMC methods since the Henriques et al. (2013) version of L-Galaxies. The calibration involves testing multiple sets of the free parameters and comparing model predictions with observational constraints, such as stellar mass functions (SMFs), the fraction of quiescent galaxies (fQ), the neutral hydrogen mass function (HIMF), and the cosmic star formation rate density (CSFRD), among others. To date, L-Galaxies is the only SAM that systematically applies a robust calibration using a Markov chain Monte Carlo (MCMC) algorithm, without requiring additional visual inspection.
In Araya-Araya et al. (2025), we introduced a novel calibration framework for L-Galaxies, testing multiple combinations of observational constraints by varying the source of the observables and omitting some constraints. Our primary goal was to determine whether a robust calibration method could find a model for reconciling the tension of modelling dusty star-forming and massive quiescent galaxies at high redshift simultaneously. Although Araya-Araya et al. (2025) highlighted the high degree of degeneracy in L-Galaxies – and likely in all galaxy formation models – where models with distinct underlying physics can yield similar likelihoods, we identified a set of parameters that reasonably match the sub-millimetre number counts (S870) and are consistent with lower limits on the number density of massive quiescent galaxies at high redshift. This model, referred to as ‘no HIMF’, was calibrated using the stellar mass function (SMF) and quiescent galaxy fraction (fQ) at z = 0.4 and z = 2.8 from Leja et al. (2020, 2022), respectively, along with the number density of bright sub-millimetre galaxies (S870 ≥ 5.2 mJy) at z = 2.8 from Dudzevičiūtė et al. (2020). A list of the 15 recalibrated free parameters is presented in Table 1. A detailed description of these free parameters is provided in the Supplementary Material of Henriques et al. (2020).
Summary of the L-Galaxies model used in this paper.
The main physical mechanisms that enable this model to provide a reasonable match to both DSFG and MQ number counts at high redshift are outlined below, and discussed in more detail in Araya-Araya et al. (2025). One key aspect of the model is the importance of merger-induced starbursts. In this model, the star formation efficiency during mergers is high, reaching up to ∼90% in equal-mass (1:1) mergers. Hence, starbursts play a key role in rapidly forming stars and depleting cold gas reservoirs. As previously mentioned, mergers are also the primary channel for the growth of supermassive black holes (SMBHs). In this model, the fraction of cold gas accreted by the SMBH during a merger is fixed at ∼3%, independent of halo mass. Interestingly, among the models tested in Araya-Araya et al. (2025), this specific implementation has the highest AGN feedback strengths and provides the best agreement with the observed SMBH mass function at z = 0. The efficiency of gas reheating due to SN feedback in this model lies between those that best match the sub-millimetre number counts and those that most accurately reproduce the massive quiescent population. However, the fraction of SN energy allocated to driving outflows is the lowest for intermediate- and high-mass systems, implying that less energy is used to eject gas from galaxies in these halos.
It is important to note that the Henriques et al. (2020) version of L-Galaxies does not explicitly track dust formation and destruction – a feature recently introduced in the Yates et al. (2024) version – nor does it directly compute sub-millimetre fluxes. Therefore, we adopt the same approach as in Araya-Araya et al. (2024, 2025) to model sub-millimetre flux densities. Specifically, we assume that 40% of the metals in the cold gas phase of the galaxies are in the form of dust (Dwek 1998), which is a reasonable assumption for massive galaxies. The sub-millimetre flux density at 870 μm (S870) is then estimated using the scaling relation presented by Cochrane et al. (2023a), which is derived using high-resolution radiative transfer simulations (see Cochrane et al. 2019, 2022, 2023b, 2024). Essentially, in their relation, the S870 flux density depends on the star formation rate (SFR), stellar mass (M★), dust mass (Mdust), and redshift (z) as
 (1)
(1)
where log α = −0.77, β = 0.32, γ = 0.13, δ = 0.65, and η = 0.65. We note that the SFR is calculated as the total stellar mass formed within the last ∼14 Myr (a timescale that decreases with increasing redshift), consistent with the interval adopted in Cochrane et al. (2023b). This timescale corresponds to the internal binning of 20 sub-steps that L-Galaxies uses to trace galaxy evolution between two consecutive snapshots.
3. Results
In this section, we present the evolution of key galaxy properties across cosmic time for the massive quiescent galaxies within our semi-analytic model. In particular, we aim to explore the link between this population and sub-millimetre-bright dusty star-forming galaxies.
In Figure 1, we present the star formation rate (SFR)–stellar mass (M★) relation of galaxies in our model at similar redshifts as to the selected MQs analysed in this work. We define MQs following the criteria of Carnall et al. (2020):
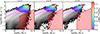 |
Fig. 1. Star formation rate (SFR)–stellar mass (M★) relation at z = 2, 3, and 4 is shown in the first, second, and third panels, respectively, using the recalibrated version of L-Galaxies from Araya-Araya et al. (2025). The dots represent bright DSFGs with S870 ≥ 1 mJy, colour-coded by their S870 flux density (see colour-bar), derived using the scaling relations presented by Cochrane et al. (2023a). The red dashed lines indicate the thresholds in specific star formation rate and stellar mass used to separate quenched and massive galaxies, respectively, following the definition of Carnall et al. (2020). The pink line and coloured area correspond to the main sequence of galaxies in our model and its 1σ dispersion. Overall, bright DSFGs are located in the massive, star-forming region in the diagram and lie on, or just above, the main sequence. As expected, the massive, quenched region is less populated at higher redshifts. |
-
log(M★/M⊙)≥10.6
-
sSFR ≤ 0.2/tobs(z)
where sSFR denotes the specific star formation rate (SFR/M★), and tobs(z) is the age of the Universe at redshift z. The MQ regime is indicated in Figure 1 by the light red shaded region. As expected, the number of MQs in our model declines with increasing redshift. In total, we find 10, 805 MQs at z = 2, 446 at z = 3, and just 21 at z = 4 within the full (713.6 cMpc)3 Millennium volume. For completeness, we also show the main sequence in Figure 1, which we obtained by calculating, in stellar mass bins, the median and standard deviation of the SFR of star-forming (sSFR > 0.2/tobs(z)) galaxies.
We model the 870 μm sub-millimetre flux density (S870) based on each galaxy’s dust mass, star formation rate, stellar mass and redshift, using the scaling relations presented by Cochrane et al. (2023a), as described above. It is important to note that the default Henriques et al. (2020) version of L-Galaxies overpredicts cold-gas metallicities compared to observational data at high redshift (by ∼0.40 dex for galaxies with 9.0 ≤ log(M★/M⊙) < 10 at z ∼ 3). This issue was addressed by Yates et al. (2021), who increased the metal-ejection efficiency from SN feedback (free parameters not included in the MCMC framework of Henriques et al. 2020 or Araya-Araya et al. 2025). We find that our recalibrated version predicts cold-gas metallicities that are slightly higher (by ∼0.25 dex for galaxies in the same stellar-mass and redshift bins) than those of Yates et al. (2021). We classify DSFGs as those with S870 ≥ 1 mJy, in line with the faintest detected sources in large sub-millimetre surveys such as AS2UDS (Simpson et al. 2017; Stach et al. 2018, 2019; Dudzevičiūtė et al. 2020). We show their positions in the SFR–M★ plane as coloured dots, where the colour encodes the sub-millimetre flux. From Figure 1, we see that most DSFGs in our model are already massive at the selected redshifts. Brighter DSFGs tend to populate the higher-mass end of the plane, residing on or above the main sequence. Notably, all DSFGs with S870 ≳ 2 mJy exceed the stellar mass threshold used to define MQs in this study. The formation and evolution of DSFGs at z = 2, 3, and 4 will be studied more extensively in a future work. Here, we focus primarily on the progenitors of MQs.
3.1. High-redshift massive quiescent galaxies were sub-millimetre bright at earlier cosmic times
In this section, we explore possible evolutionary connections between MQs and DSFGs. We would like answers to the questions of whether MQs were sub-millimetre-bright before quenching, what the maximum sub-millimetre flux density reached by MQs was in the past, when this peak occurred, and whether the answers to these questions depend on the redshift at which the MQ is identified.
As described above, we select massive MQs at z = 2, 3, and 4. In order to analyse the evolution of these selected galaxies across cosmic time, we track each galaxy along what is called its main progenitor branch (MPB) by matching galaxies at different redshifts with the same MainLeafID (i.e. that have the same original progenitor galaxy). First, we explore the past evolution of sub-millimetre flux density for our MQ samples selected at different redshifts. In Figure 2, we show the median evolution of S870 flux density for MQs selected at z = 2, 3, and 4 in four stellar mass (at the selected redshift) bins. The most notable trend in Figure 2 is that MQs tend to reach a peak in sub-millimetre flux density before the redshift at which they are selected. The typical S870 evolution exhibits a gradual increase with cosmic time (i.e. with decreasing redshift), between z ∼ 9 and its peak, followed by a rapid decline at lower redshifts. This can be seen for MQs at the three analysed redshifts. Another noteworthy trend is that, on average, MQs with higher stellar masses tend to reach higher peak sub-millimetre flux densities.
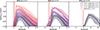 |
Fig. 2. Evolution of the S870 flux density of massive quiescent galaxies (MQs) selected at z = 2, 3, and 4 is shown in the first, second, and third panel, respectively. At each selected redshift, MQs are divided into four stellar mass bins of width 0.4 dex, starting from a lower limit of log(M★/M⊙) = 10.6. The coloured regions and lines represent the 16th, 50th, and 84th percentiles of MQs within each stellar mass bin. Overall, the S870 evolution of MQs exhibits a gradual increase with decreasing redshift, reaching a peak before undergoing a rapid decline at later times. Notably, the most massive MQs consistently display the highest S870 peak values. |
Motivated by the key trend in Figure 2, where MQs selected at different redshifts exhibit a peak in sub-millimetre flux density at different cosmic times, we derive both the maximum sub-millimetre flux density, S870, max, and the redshift at which it occurs, z(S870, max), for every MQ. The distributions of these properties are shown in Figure 3, for each of the three MQ samples. As anticipated from Figure 2, almost all MQs at the three selected redshifts exhibit bright sub-millimetre peaks (S870, max ≳ 1 mJy). We see from the upper panel of Figure 3 that ∼86%, 96%, and 91% of MQs at z = 2, 3, and 4, respectively, exceeded 1 mJy at some point in their evolution. However, only ∼7%, 9%, and 5% of these MQs (at the same redshifts) reached S870, max ≥ 3 mJy. In exceptional cases, ∼2%, 1%, and 0% MQs at z = 2, 3, and 4, attained S870 ≥ 5 mJy during their formation history. Therefore, in our model, the progenitors of the vast majority of MQs are DSFGs. The median S870, max is 1.4, 1.6, and 1.8 mJy, for MQs at z = 2, 3, and 4. Based on the redshift distributions displayed in the lower panel of Figure 3, these sub-millimetre peaks occurred at the following median redshifts: z(S870, max) = 3.1, 4.3, and 5.5, for MQs selected at z = 2, 3, and 4, respectively.
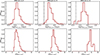 |
Fig. 3. Distribution of the maximum S870 flux density reached by each modelled galaxy across its entire formation history, S870, max (first row), and when it occurred (second row; redshift distribution), for massive quiescent galaxies (MQs) selected at z = 2, 3, and 4 (from left to right). The minimum S870, max reached by any of the MQs is indicated by the vertical dashed black line. |
Another tentative correlation apparent in Figure 2 is that more massive MQs tend to have reached higher peak sub-millimetre fluxes. To explore this further, we present in Figure 4 the maximum 870 μm flux density reached by MQs (S870, max) as a function of their stellar mass at the selected redshift. Our results reveal a strong correlation between these two properties across all three redshifts analysed. The scatter in this relation is typically less than ∼0.5 dex and tends to decrease with increasing stellar mass. Interestingly, at fixed stellar mass, the deviation from the median relation is correlated with the redshift at which the sub-millimetre peak occurred: MQs with a given stellar mass, M★, reached a brighter S870, max if the sub-millimetre emission peaked at an earlier epoch. This correlation arises because, in our model, galaxies that reached their sub-millimetre peak earlier have, on average, higher star formation rates than those at lower redshifts.
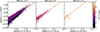 |
Fig. 4. Maximum value of S870, S870, max, reached across the formation history of massive quiescent galaxies (MQs), as a function of stellar mass at redshifts z = 2, 3, and 4 (from left to right). The data points are coloured according to the redshift at which S870, max occurred, z(S870, max). A strong correlation is found between the stellar mass of MQs and their S870, max, with a dispersion that also correlates with z(S870, max). At fixed stellar mass, MQs that reached S870, max at earlier times tended to exhibit brighter S870 flux densities. |
The correlation between stellar mass and S870, max appears to be independent of the redshift at which the MQs are selected. To quantify this, we perform a linear fit between S870, max and stellar mass for each sample. In Table 2 we present the best-fit parameters and their associated uncertainties in for the linear function:
 (2)
(2)
Based on the best-fit parameters, the derived scaling relation is, within the uncertainties, redshift-independent. This relation could thus be used to estimate the maximum 870 μm flux density reached by massive quiescent galaxies at high redshift, at least within the redshift range z = 2 − 4.
The bottom panels of Figure 3 show the distribution of redshifts at which individual MQs reached their sub-millimetre peak, z(S870, max). However, the median z(S870, max) is not necessarily the redshift at which the majority of MQs were sub-millimetre bright. For example, some MQs already surpass S870 ≥ 1 mJy prior to their z(S870, max), as is shown in Figure 2 (see the gradual increase of S870 with decreasing redshift, prior to the peak). To assess this, in Figure 5 we quantify the fraction of MQs selected at z = 2, 3, and 4 that exceeded a given S870 threshold (1 mJy, 3 mJy, or 5 mJy; see three coloured lines), as a function of redshift. The redshift at which the maximum number of the main progenitors of MQs exceeded S870 = 1 mJy is z ∼ 3.4, 4.3, and 5.5, for MQs selected at z = 2, 3, and 4, respectively. Overall, the redshifts at which most MQs exceeded the three flux thresholds are broadly consistent with the redshifts at which they reached S870, max. At these peaks, a significant fraction – 50%, 66%, and 67% – of the main progenitors of MQs selected at z = 2, 3, and 4, exceed the threshold of S870 = 1 mJy. However, only a small fraction (less than ∼8%) ever reached flux densities brighter than 3 mJy. For example, just one (∼5%) MQ selected at z = 4 exceeded S870 = 3 mJy, and none surpassed 5 mJy.
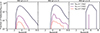 |
Fig. 5. Fraction of massive quiescent galaxy (selected at z = 2, 3, and 4; first, second, and third panel, respectively) progenitors that exceed S870 flux densities of 1 mJy (dark blue), 3 mJy (purple), and 5 mJy (orange) vs redshift. At the redshift at which the distributions peak, a significant fraction of MQ progenitors exceed S870 = 1 mJy. For example, 50%, 66%, and 67% of MQs selected at z = 2, 3, and 4, respectively, exceeded S870 = 1 mJy at z ∼ 3.4, 4.3, and 5.5. These numbers are lower for higher S870 thresholds: at their peaks, ∼3% of MQs selected at z = 2, ∼6% at z = 3, and ∼5% at z = 4 exceed 3 mJy. |
3.2. Not all dusty star-forming galaxies are progenitors of high-redshift MQs
We have already shown that, in our model, massive quiescent galaxies at z = 2, 3, and 4 were sub-millimetre bright in the past. For instance, we find that ∼86%, 96%, and 91% of MQs at z = 2, 3, and 4, exceeded 1 mJy at some point in the past. Only ∼7%, 9%, and 5% reached S870, max ≥ 3 mJy, while ∼2%, 1%, and 0% surpassed 5 mJy. However, it is not yet clear whether a significant fraction of all DSFGs – defined here as galaxies with S870 ≥ 1 mJy – at those redshifts are indeed progenitors of MQs at 2 ≤ z ≤ 4. For simplicity, we do not follow galaxies once they are accreted by a more massive system. However, the fraction of MQs that are eventually incorporated into a more massive galaxy is modest (≲24%), regardless of the selected redshift.
In this section, we analyse the entire DSFG population at the redshifts when the sub-millimetre emission of the selected MQs at z = 2, 3, and 4 was most common. We therefore select DSFGs at z = 3.4, 4.3, and 5.5, respectively (based on Figure 5). We separate the DSFG sample into three bins based on sub-millimetre flux density at the selected redshift: faint (1 < S870/mJy ≤ 3), intermediate (3 < S870/mJy ≤ 5), and bright (S870/mJy > 5). At z = 3.4, these bins include 56 753, 1500, and 250 DSFGs. The corresponding numbers are 22 771, 411, and 60 at z = 4.3, and 5460, 54, and 4 at z = 5.5. We note that the number of DSFGs is significantly larger than that of MQs at z = 2, 3, and 4. Thus, we expect that not all DSFGs in our model are progenitors of MQs at 2 ≲ z ≲ 4. Next, we quantify how many of the overall DSFG population evolve into high-redshift MQs and when these DSFGs quench.
In Figure 6, we show the cumulative fraction of DSFGs – binned by S870 – that become massive (log(M★/M⊙)≥10.6) and quiescent (sSFR ≤ 0.2/tobs(z)). Notice that cumulative fractions for faint DSFGs never reach 100%, primarily because some of them are accreted into more massive systems. Figure 6 reveals that brighter DSFGs quench earlier. For example, all bright DSFGs (S870/mJy > 5) identified at z = 5.5 become massive and quiescent by z = 2, whereas only ∼40% of intermediate and ∼20% of faint DSFGs do. We also calculate the redshift at which 50% of bright DSFGs selected at z = 3.4, 4.3, and 5.5 become massive and quiescent. These are zMQ = 1.85, 2.08, and 2.54, respectively. In contrast, 50% of faint DSFGs (1 < S870/mJy ≤ 3) selected at the same redshifts meet the MQ criteria only by zMQ = 1.23, 1.34, and 1.42, respectively. In summary, DSFGs that are higher redshift and brighter quench earlier.
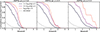 |
Fig. 6. Cumulative fraction of dusty star-forming galaxies (DSFGs) selected at z = 3.4, 4.3, and 5.5 (from left to right) that become massive and quiescent as a function of redshift. The dark blue, purple, and orange lines represent DSFGs with sub-millimetre flux densities of 1 < S870/mJy ≤ 3, 3 < S870/mJy ≤ 5, and S870/mJy > 5, respectively. The grey line indicates the fraction of DSFGs that were accreted by a more massive galaxy. We note that all DSFGs with S870 ≳ 3 mJy are already massive at all selection redshifts. The most remarkable trend is that brighter DSFGs quench more rapidly than their fainter counterparts. For example, 50% of the bright DSFGs selected at z = 3.4, 4.3, and 5.5 become quenched by z ∼ 1.85, 2.08, and 2.54, respectively. In contrast, the fainter DSFGs across all selected redshifts tend to quench later, with similar quenched redshift, typically around z ∼ 1.3. This is because faint DSFGs selected at high redshift may continue to grow and potentially become brighter at later times. |
We reiterate that the majority of MQs at z = 2, 3, and 4 lie within the faintest S870 bin (see Figures 3 and 5). However, less than 50% of faint DSFGs at z = 5.5 will become MQs by z = 2. Therefore, while the majority of MQs at z = 2, 3, and 4 were DSFGs at z = 3.4, 4.3, and 5.5, only a small fraction of all DSFGs evolve into massive and quiescent by those redshifts (z ≳ 2). This implies that MQs may follow a distinct evolutionary path, different from that of the average DSFG.
To highlight the main differences in the evolution of high-redshift MQ progenitors compared to the overall DSFG population, we present in Figure 7 the median stellar mass growth attributed to secular processes (In-Situ), accretion via major and minor mergers (Mergers), and merger-induced starbursts (Burst) for bright, intermediate, and faint DSFGs, compared with the MQ population. To aid interpretation, Figure 7 also shows the median redshifts at which the galaxy population exceeded S870 > 1 mJy for the first time (dots), reach their sub-millimetre flux peak (diamonds), and quench (crosses). Figure 7 shows that the dominant mechanism responsible for building up stellar mass in DSFGs at early epochs (z ≳ 3) is secular star formation. In general, the slope of the in-situ stellar mass growth is similar across all galaxy populations, with differences primarily in their initial stellar mass. A notable exception is the brightest DSFGs and MQ progenitors selected at z = 5.5, which exhibit accelerated in-situ growth at z ∼ 6 for bright DSFGs and z ∼ 7 for MQ progenitors. By contrast, MQ progenitors selected at lower redshifts (z = 3.4 and 4.3) follow similar in-situ mass growth to faint DSFGs selected at the same redshifts. This is consistent with the finding that most MQs selected at z = 2, 3, and 4 reached an S870, max of between 1 mJy and 3 mJy (see Figure 3).
The redshift at which in-situ stellar mass growth begins to flatten – indicating suppression of star formation – coincides with the redshift at which stellar mass accretion from mergers (and associated starbursts) becomes significant across all four galaxy populations. On average, this transition occurs at a slightly lower redshift than the selection redshift of the MQs, and after the typical redshift when they reached their sub-millimetre emission peak. This suggests that, on average, these galaxies became sub-millimetre bright primarily due to secular processes rather than merger-induced starbursts. It is important to note that the redshift at which S870, max occurs is not precisely determined, due to the time resolution of the simulation (∼14 Myr). Nevertheless, these galaxies are already sub-millimetre bright prior to reaching their maximum sub-millimetre flux density.
The primary difference in stellar mass evolution across the four populations is when the first significant merger event occurred. Figure 7 clearly shows that violent mergers occurred earlier in MQ progenitors than in the broader DSFG population, setting them on distinct evolutionary paths. In fact, on average, the progenitors of MQs selected at z = 2 and 3, and faint DSFGs (at z = 3.3 and 4.3), exceeded the S870 = 1 mJy threshold at similar epochs, whereas the progenitors of MQs at z = 4 align better with intermediate DSFGs at z = 5.5. In all cases, the sub-millimetre episode occurred before the violent merger. Therefore, galaxies become DSFGs (S870 > 1 mJy) via in-situ star formation. Among the broader DSFG population, brighter DSFGs experienced mergers earlier than fainter ones. For example, for DSFGs selected at z = 5.5 (when sub-millimetre emission was prevalent among MQs at z = 4), the median redshift of the first major merger event is approximately z ∼ 5 for those DSFGs that are MQ progenitors, and z = 4, 3, and 2 for the wider bright, intermediate, and faint population of DSFGs, respectively.
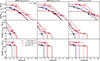 |
Fig. 7. Median stellar mass evolution attributed to secular processes (in situ, top panels), accretion via mergers (mergers, middle panels), and merger-induced starbursts (burst, bottom panels) for massive quiescent progenitors (solid red line) the bright (dashed orange line), intermediate (purple dashed lines), and faint DSFGs (dark blue dashed lines). From left to right we show DSFG and MQ progenitors selected at z = 3.4, 4.3, and 5.5. The dots, diamonds, and crosses highlight the median redshifts at which the galaxy population exceeded S870 > 1 mJy for the first time, reaches the sub-millimetre peak, and quenches. The formation of all four galaxy populations is initially dominated by secular star formation, suggesting that sub-millimetre emission is not primarily triggered by mergers at early times. The main difference in stellar mass growth between typical DSFGs and MQ progenitors lies in the timing of major mergers. MQ progenitors experience a significant merger event earlier, which induces an extreme starburst and rapid SMBH-driven cold gas accretion, thereby depleting the available gas for continued secular star formation. Following this early violent merger, these galaxies grow their stellar mass primarily through dry mergers. |
Following the first major merger, stellar mass growth is dominated by additional mergers, often without significant subsequent starbursts, suggesting dry merger events. Notably, while MQ progenitors underwent at least one significant merger earlier, their stellar mass accretion via mergers shows an extended plateau phase (seen particularly clearly for those selected at z = 5.5 and 4.3), indicating a period with few significant mergers. This is followed by a renewed phase of growth from mergers, though at a slower rate, on average, than is seen in DSFGs (except for MQ progenitors at z = 5.5, whose post-plateau mass growth is similar to that of the wider population of intermediate-luminosity DSFGs).
Figure 7 also indicates that the first significant merger triggered an intense starburst (see lower panels) that consumed a significant amount of cold gas. However, this was not the unique mechanism responsible for quenching the star formation, since a brief period of secular star formation followed. As previously discussed, in the L-Galaxies SAM, mergers are the main channel for supermassive black hole (SMBH) growth via cold gas accretion. In particular, the model employed in this work assumes highly efficient accretion, leading to rapid SMBH growth. Consequently, merger events can simultaneously drive both extreme starbursts (consuming cold gas) and AGN activity (suppressing cooling).
To investigate the primary physical processes responsible for quenching star formation in DSFG and MQ progenitors, we explore the evolution of the median energy injection rates due to supernova (SN) and AGN feedback2 for the four galaxy populations at the three selected redshifts, as shown in Figure 8. The most prominent trend in Figure 8 is that the SN feedback energy injection rate gradually increases from early times (z ∼ 9), peaking at a redshift that coincides with the onset of AGN feedback – which also matches the average redshift of the first relevant merger (see Figure 7). After this peak, the SN energy input rapidly declines, a trend that can be attributed to the drop in star formation following the intense merger-induced starburst, particularly in MQ progenitors.
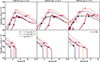 |
Fig. 8. Evolution of the median energy input rate from supernovae (SN; top panels) and active galactic nuclei (AGN; bottom panels) for massive quiescent progenitors (red solid lines), faint (dark blue dashed lines), intermediate (purple dashed lines), and bright (orange dashed lines) dusty star-forming galaxies selected at z = 3.4 (left panel), z = 4.3 (central panel), and z = 5.5 (right panel), the redshifts at which the majority of MQs at z = 2, 3, and 4, were DSFGs. The crosses indicate the median redshift at which a given galaxy population first satisfied the quiescent criteria (sSFR ≤ 0.2/tobs(z)). The energy input from AGN feedback rises rapidly close to the quenching epoch, dominating the energy injection rate over SN feedback by at least two orders of magnitude. This suggests that AGN feedback is the main mechanism that quenches the star formation in the four populations, but that this happens earlier for MQs. |
The lower panels of Figure 8 show that quenching (see cross symbols) typically occurs after strong AGN feedback. While SN feedback continues to contribute energy, its input is, on average, more than two orders of magnitude lower than that from AGN (see upper panels). Hence, the AGN feedback appears to be the dominant mechanism responsible for quenching in DSFGs and MQs in our model – particularly when triggered early. In the L-Galaxies framework, AGN feedback operates by injecting energy into the hot gas halo, thereby suppressing cooling. The AGN energy injection rate is tied to hot gas accretion onto the SMBH, which scales with both the hot gas mass and the SMBH mass. This means that significant AGN activity is initiated in galaxies with large hot gas reservoirs and/or large SMBHs grown through mergers and cold gas accretion. This is coupled with the starburst, which consumes a large fraction of the cold gas and reduces the star formation rate. The subsequent decline in SN feedback energy is therefore a natural consequence of depleting star formation. While Figure 8 may suggest that SN feedback plays a minor role in quenching, it nonetheless contributes to heating the cold gas into the hot phase, helping to set the conditions that enable AGN feedback to become effective following SMBH growth.
Interestingly, the maximum energy input rate from AGN is lower for the MQ progenitors than for the brightest classes of DSFGs, at the time at which the populations become quiescent. This might suggest that weaker AGN feedback is required to quench star formation in MQs, but it is important to consider that the impact of this energy release on the host galaxy depends on its mass. In this context, even when presenting weaker AGN feedback, the energy input from overmassive SMBHs relative to the galaxy’s gas mass may suppress the gas cooling more rapidly. To explore this, we present in Figure 9 the redshift evolution of the SMBH-to-stellar mass ratio (MBH/M★) for progenitors of MQs and DSFGs at z = 3.4, 4.3, and 5.5.
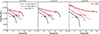 |
Fig. 9. Evolution of the median supermassive black hole mass (MBH) to stellar mass (M★) ratio for MQ progenitors (red solid line), and for faint (dark blue dashed line), intermediate (purple dashed line), and bright (orange dashed line) DSFGs selected at z = 3.4 (left panel), z = 4.3 (central panel), and z = 5.5 (right panel), the typical redshifts at which MQs at z = 2, 3, and 4, respectively, exceeded at least 1 mJy. The crosses and their error bars indicate the median, along with the 16th and 84th percentiles, of the redshift at which each galaxy population quenched. DSFGs, independently of selection redshift or sub-millimetre flux density, exhibit a similar MBH/M★ ratio at the time of quenching (log(MBH/M★)∼ − 3.75). In contrast, MQs host more massive SMBHs relative to their stellar mass at the time of quenching, even though the overall energy input from AGN is typically lower (see Figure 8), and reflects the lower stellar masses of the highest-redshift MQs at the time of quenching. In summary, in our model, rapid growth of a black hole triggered by an early galaxy-galaxy merger produces a black hole that is overmassive and sufficiently energetic to maintain the quenched state of the galaxy. |
The most remarkable trend in Figure 9 is that high-redshift MQ progenitors host more massive SMBHs relative to their stellar content, exhibiting higher MBH/M★ ratios than the SMBHs of typical DSFGs across cosmic time, especially at higher redshifts. In our model, SMBHs in MQs grow rapidly due to an early merger, resulting in overmassive SMBHs relative to their stellar mass. The AGN feedback associated with these SMBHs is therefore sufficiently energetic to quench the host galaxy efficiently.
Another notable trend is that the MBH/M★ ratio correlates with the sub-millimetre flux density of DSFGs; bright DSFGs exhibit higher MBH/M★ ratios than faint DSFGs at any given redshift. However, at the time of quenching (indicated by crosses in Figure 9), DSFGs show similar MBH/M★ ratios, with faint DSFGs having slightly lower values. Comparing the evolution of the MBH/M★ ratio across the different populations, DSFGs exhibit a more pronounced increase from high to low redshift than MQ progenitors, whose evolution proceeds at a significantly slower rate following very early black hole mass growth before quenching. This, combined with the results from Figure 7, which show that galaxies increase their stellar mass mainly through accretion in (dry) mergers after quenching, suggests that such events play a more important role in growing SMBHs for galaxies that quench later.
From Figure 7, we find that, in general, all analysed galaxy populations reached their sub-millimetre peak close to the time of the first significant merger event. This, in turn, triggered AGN feedback (see Figure 8), and, in the case of high-redshift MQs, the resulting SMBH (formed via the early merger) is overmassive relative to their stellar content (see Figure 9).
In Figure 10, we present the timescale distributions, tquench − tsubmm − peak, for both high-redshift MQ progenitors and DSFGs selected at z = 3.4, 4.3, and 5.5. As anticipated from Figure 9, MQ progenitors quench rapidly after reaching their sub-millimetre peak due to the enhanced growth of their SMBHs relative to their stellar mass. A zoomed-in version of the MQ timescales is shown in Figure B.1. On average, MQs observed at z = 2, 3, and 4 quenched their star formation approximately 0.9 Gyr, 0.6 Gyr, and 0.4 Gyr, respectively, after reaching their sub-millimetre peak. This indicates that MQs selected at higher redshift generally quenched more rapidly than those at lower redshift. In contrast, the timescales between the sub-millimetre peak and quenching for DSFGs are longer and exhibit greater dispersion, particularly for the faintest sources. For instance, although the peak of the distributions is similar among the DSFG populations, the median timescales for faint DSFGs at z = 3.4, 4.3, and 5.5 are consistently around ∼1.95 ± 0.1 Gyr. Similarly, the median timescales for intermediate DSFGs do not vary significantly across the redshifts analysed, with tquench − tsubmm − peak ∼ 1.32 − 1.46 Gyr. In contrast, the timescales for bright DSFGs selected at z = 3.4, 4.3, and 5.5 are ∼1.37 Gyr, 1.32 Gyr, and 0.8 Gyr, respectively. This trend highlights the different evolutionary pathways followed by DSFGs, which we will explore further in a forthcoming study.
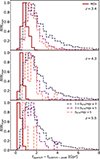 |
Fig. 10. Distribution of timescales between the sub-millimetre peak (S870, max) and subsequent quenching is shown for massive quiescent (MQ) progenitors (solid red histogram), and for faint (dark blue dashed), intermediate (purple dashed), and bright (orange dashed) dusty star-forming galaxies (DSFGs) selected at z = 3.4 (first panel), 4.3 (second panel), and 5.5 (third panel), the typical redshifts at which MQs at z = 2, 3, and 4, respectively, were in a DSFG phase. The timescale distributions for DSFGs exhibit similar peaks, although faint DSFGs show greater dispersion, with tails towards longer timescales. At z = 5.5, bright DSFGs present shorter timescales than their analogues at lower redshifts. MQ progenitors show systematically shorter timescales than DSFGs, with durations increasing for MQs selected at lower redshifts. A zoomed-in version of the MQ timescale distribution is shown in Figure B.1. |
4. Discussion
Observational results suggest a connection between dusty star-forming galaxies (DSFGs) and massive quiescent galaxies (MQs) at high redshift, supported by the typical inferred star formation histories of MQs (i.e. intense, short-lived starbursts; e.g. Glazebrook et al. 2017; Forrest et al. 2020; Carnall et al. 2023b), number densities (Valentino et al. 2020), and their host halo masses, e.g. (Wilkinson et al. 2017). However, this potential link – where DSFGs serve as progenitors of high-redshift MQs – has not yet been thoroughly explored within the galaxy formation modelling framework, as simulations often struggle to reproduce DSFG and MQ populations simultaneously. Here, we used one of the semi-analytic models from Araya-Araya et al. (2025), which provides a reasonable representation of these populations, to investigate the connection between DSFGs and MQs.
4.1. The connection between dusty star-forming and massive quiescent galaxies at high redshift
The model from Araya-Araya et al. (2025) predicts that approximately 86%, 96%, and 91% of MQs at z = 2, 3, and 4, respectively, exceeded a flux density of 1 mJy in the 870 μm band at some point in their past (S870, max; see Figure 3), indicating a strong link between DSFGs and MQs at high redshift. However, only a small fraction ever reached S870 ≥ 3 mJy (around 7%, 9%, and 5% of MQs at z = 2, 3, and 4, respectively), suggesting that while most MQs were once DSFGs, more extreme DSFGs have a higher probability of quenching earlier and becoming MQs at z > 2. This is broadly consistent with the findings of Valentino et al. (2020), who also examined this connection using IllustrisTNG. However, our model indicates a stronger relationship, with nearly all MQs at high redshift reaching at least 1 mJy. This discrepancy may arise because the IllustrisTNG model underestimates sub-millimetre number counts (see Hayward et al. 2021).
We derive and analyse the redshift distribution at which MQs reach their maximum sub-millimetre emission (Figure 3, bottom panels). For MQs selected at z = 2, the peak sub-millimetre flux density occurs at z(S870, max) = 2.9 − 4.0 (16th–84th percentile), with a median of z = 3.2. Similarly, for MQs selected at z = 3, the distribution spans z = 4.0 − 5.0, peaking at z = 4.3, while MQs at z = 4 show z(S870, max) = 5.0 − 5.9 and a median of z = 5.5. This trend is expected, as some MQs at a given redshift could have quenched earlier, and there is less cosmic time before higher-redshift snapshots; indeed, we find that MQs exhibit similar quenching timescales after reaching their sub-millimetre peak (Figure 10).
Although the redshift ranges of peak emission are similar, this does not imply that MQ progenitors become DSFGs only at the time of S870, max. As shown in Figure 2, the sub-millimetre flux density of an individual galaxy increases gradually with decreasing redshift towards its peak. In Figure 5, we quantify the fraction of MQ progenitors that exceed a given S870 threshold as a function of redshift. We find that 50%, 66%, and 67% of MQs selected at z = 2, 3, and 4, respectively, surpass S870 = 1 mJy at z ∼ 3.4, 4.3, and 5.5. Based on these values, we select the full DSFG population at these corresponding redshifts.
We find that a large fraction of DSFGs at z ≳ 3 do not evolve into MQs by z ≳ 2. In Figure 6, we quantify the fraction of DSFGs selected at z = 3.4, 4.3, and 5.5 that subsequently evolve into massive and quiescent systems by a given redshift. While the typical MQ progenitors reach S870 ∼ 1 − 3 mJy, less than 10% of the total faint DSFG population (S870 ≲ 3 mJy) quench by the selected epochs. This result implies that the majority of DSFGs do not follow the same evolutionary pathway as MQ progenitors (see Section 4.2).
Further evidence supporting the DSFG–MQ connection is presented in Figure 4, which shows the relationship between the stellar mass of MQs and their historical maximum S870 flux density. The clear, nearly redshift-independent correlation between stellar mass (an observed-day property) and S870, max (a proxy for past star formation) implies that the most massive MQs were also the brightest in the sub-millimetre regime. This suggests that extreme DSFGs (S870 ≳ 5 mJy) may indeed be the progenitors of the most massive (M★ ≳ 1011 M⊙) quiescent galaxies at high redshift. This relation may reflect the early evolution of massive systems, as the overall DSFG population follows the M★–SFR main sequence (see Figure 1). In this framework, higher stellar masses correspond to higher SFRs, which lead to enhanced dust production (from supernovae) and consequently to higher S870 flux densities.
4.2. How dusty star-forming galaxies become massive quiescent at high redshift
From our model, we find that not all DSFGs evolve rapidly into massive quiescent galaxies. We investigate the physical mechanisms that transform a sub-set of DSFGs into MQs. First, we analyse the median stellar mass growth through secular processes, accretion via mergers, and merger-induced starbursts for DSFGs with different sub-millimetre flux densities, along with MQ progenitors (Figure 7). The key difference in stellar mass assembly between these populations lies in the timing of their first major merger. In the L-Galaxies semi-analytic model, mergers trigger starbursts, and in the Araya-Araya et al. (2025) framework, this mechanism converts the available cold gas into stars with high efficiency. For example, in equal-mass mergers, approximately 90% of the cold gas is consumed to form new stars. As a result, a significant fraction of the final stellar mass – compared to the previously in-situ-formed mass – originates from merger-induced starbursts in MQs selected at a given redshift. We also note that the starburst event typically coincides with the epoch at which MQs reach their maximum sub-millimetre flux density. This is consistent with the findings of Forrest et al. (2020), who observed that ultramassive galaxies at z > 3 that have already quenched display post-starburst signatures.
As noted above, an early major merger dictates the evolutionary paths followed by the general DSFG population and high-redshift MQ progenitors. In addition to inducing starbursts, mergers are also the main driver of supermassive black hole growth in L-Galaxies. In this context, merger events can simultaneously boost both supernova (SN) and AGN feedback. To identify the dominant mechanism responsible for quenching high-redshift MQs, we present in Figure 8 the median energy injection from SN and AGN feedback as a function of redshift for the populations under study. As expected, AGN feedback dominates, with energy input exceeding that of SN feedback by at least two orders of magnitude near the quenching epoch. This scenario is consistent with observational results: massive galaxies at z ≳ 3 often host AGN (Marchesini et al. 2010; Stefanon et al. 2015; Marsan et al. 2017; Forrest et al. 2020), which become more luminous (a proxy for AGN feedback strength) with increasing host stellar mass, particularly in already quenched systems (Ito et al. 2022).
Figure 8 thus supports a scenario in which both DSFGs and high-redshift MQs quench primarily due to AGN feedback, triggered by mergers that are also associated with the sub-millimetre peak. However, as shown in Figure 10, high-redshift MQ progenitors quench more rapidly than the overall DSFG population after reaching their sub-millimetre peak. We explore this in Figure 9, where we present the evolution of the SMBH-to-stellar mass ratio for the various populations. We find that the rapid quenching of high-redshift MQs is driven by early mergers that result in overmassive SMBHs relative to the stellar mass of MQ progenitors. Consequently, less AGN feedback energy is required to quench star formation in these systems.
Our predicted scenario is broadly consistent with the results of Xie et al. (2024) based on the GAEA SAM, where mergers trigger AGN feedback that ultimately quenches star formation. Our prediction of overmassive black holes in MQs, relative to their stellar mass when compared to star-forming galaxies of similar stellar mass (in our case, DSFGs), is also reproduced in the IllustrisTNG and ASTRID simulations (Weller et al. 2025). However, in contrast to our model, mergers in IllustrisTNG do not play a significant role in suppressing star formation in MQs at z ≳ 3, as shown by Kurinchi-Vendhan et al. (2024); this is likely due to the different model for black hole growth in IllustrisTNG.
4.3. Limitations and caveats
As discussed in Araya-Araya et al. (2025), the galaxy formation model used in this work (referred to as no HIMF) is a recalibrated version of the Henriques et al. (2020) version of L-Galaxies, and, like other eight recalibrated variants, it still presents certain limitations.
Similarly to the other eight alternative versions obtained in Araya-Araya et al. (2025), the model adopted here struggles to reproduce the high-mass end of the stellar-mass function at high redshift. Additionally, it overpredicts the cosmic star formation rate density by ∼0.5 dex relative to observational constraints. However, the no HIMF model (used in this work) is among the best-performing at reproducing the number density of MQs at high redshift, showing consistency with the lower limits from observations. Nevertheless, it still underpredicts the number density by approximately 1 dex compared to recent JWST measurements at z ∼ 3.5. In contrast, six out of the nine models match or closely match the observed sub-millimetre number counts; the model used here is not the best of these models – albeit it is still in good agreement. As noted in Section 4.1, this may result in a failure to capture MQs that do not descend from DSFGs.
One likely cause of the underprediction of the high-redshift MQ population is the simplified AGN-feedback and black hole growth prescription adopted in the Henriques et al. (2020) version of L-Galaxies, originally introduced by Croton et al. (2006). In the Croton et al. (2006) framework, SMBH growth occurs mainly through mergers, which can lead to an underestimation of SMBH masses in the early Universe (z ≳ 4). In the context of the no HIMF recalibrated version presented in Araya-Araya et al. (2025), a ≲3% fraction (scaled by the mass ratio) of the cold gas is accreted during mergers, independently of the halo mass. Among all recalibrated variants, the ‘no HIMF’ model is, in fact, one of the most efficient at accreting cold gas onto SMBHs. However, because this efficiency is independent of halo mass, the resulting MBH − M★ relation remains almost constant at high redshift (see Figure C.1), leading to an underprediction of SMBH masses in massive galaxies compared with other models (see Figure 13 Lagos et al. 2025) and observational data from Decarli et al. (2010a,b), Suh et al. (2020), and Poitevineau et al. (2023) at z ∼ 3. A more sophisticated treatment of SMBH growth and formation, as implemented in the Izquierdo-Villalba et al. (2022) and Spinoso et al. (2023) versions of L-Galaxies, improves consistency with current observations. Nevertheless, our model performs reasonably well in reproducing the observed SMBH mass function and the MBH − M★ relation at low redshift.
As shown in this study, AGN feedback is the primary mechanism responsible for quenching star formation in both DSFGs and MQs at high redshift. In the Croton et al. (2006) model, AGN feedback operates exclusively on the hot gas halo, suppressing cooling flows without directly affecting the cold gas reservoir of the galaxy. In the no HIMF recalibrated model, AGN feedback is stronger than in the default Henriques et al. (2020) version. However, it still underpredicts the fraction of quiescent galaxies at high redshift–likely by the underestimation of SMBH masses at early times, as discussed above. As shown by Lagos et al. (2024) and De Lucia et al. (2024) for the SHARK and GAEA3 SAMs, implementing a more comprehensive model for AGN-driven feedback, capable, for example, of heating or ejecting cold gas, may help resolve the strong discrepancy with observed MQ abundances. Increasing the number density of MQs at high redshift would naturally enhance the predicted transition rate between DSFGs and MQs.
A key finding from Araya-Araya et al. (2025) is the high degree of parameter degeneracy in L-Galaxies, likely in all galaxy formation models, due to their large parameter space (15 free parameters in the case of L-Galaxies). Thus, although our model provides a plausible evolutionary pathway for high-redshift MQs that broadly agrees with observations, alternative models featuring different physical assumptions may also be capable of reproducing both the DSFG and MQ populations.
4.4. The nature of dusty star-forming galaxies
In this work, we explored the connection between DSFGs and MQs at high redshift, with a particular focus on the progenitors of MQs. We have shown that the progenitors of z > 2 MQs largely follow similar evolutionary pathways to faint DSFGs, characterised by sub-millimetre flux densities in the range 1 mJy < S870 ≤ 3 mJy at early times (z ≳ 5).
In comparing with the broader DSFG population, we found that these galaxies typically exceed the S870 > 1 mJy threshold at 5 ≲ z ≲ 7, depending on the redshift at which they are selected. DSFGs become sub-millimetre-bright primarily due to secular processes (Figure 7), and reach their sub-millimetre flux peak, on average, around the time of their first significant merger event–which occurs later than in the case of high-redshift MQ progenitors. Moreover, unlike the high-redshift MQ progenitors, the quenching timescales after the sub-millimetre peak in DSFGs span a wide range, from a few hundred Myr up to ∼4 Gyr in the case of the brightest DSFGs.
A natural extension of this study will be to characterise the different evolutionary pathways followed by DSFGs, along with their progenitors and descendants. As discussed in the previous sub-section, Araya-Araya et al. (2025) identified five additional models with different physical prescriptions (different free parameters) that yield sub-millimetre number counts consistent with observations. In future work, we will analyse the formation and evolution of DSFGs across these alternative models, in order to assess the robustness of our conclusions.
5. Summary
In this work, we present theoretical predictions regarding the potential connection between dusty star-forming galaxies (DSFGs) and massive quiescent galaxies (MQs) at high redshift (z = 2, 3, and 4). We used the Henriques et al. (2020) version of the L-Galaxies SAM, specifically employing the set of free parameters obtained in Araya-Araya et al. (2025), which succeeds in reproducing both of the galaxy populations studied in this work. Our main findings are summarised as follows:
-
A total of 86%, 96%, and 90% of MQs at z = 2, 3, and 4, reached at least 1 mJy in sub-millimetre flux density at some point in their past. Hence, the vast majority of MQs are the descendants of z ≳ 3.4 DSFGs (see Figure 3, top panels). The typical redshifts at which these high-redshift MQs reached their maximum sub-millimetre emission (S870, max) are z ∼ 3.1, 4.3, and 5.5, for the MQs at z = 2, 3, and 4, respectively (Figure 3, bottom panels).
-
We find a strong correlation between the stellar mass of high-redshift MQs and the maximum sub-millimetre flux density they achieved in their past, S870, max (Figure 4). The most massive MQs had the brightest past sub-millimetre emission. A linear fit yields a nearly redshift-independent relation, suggesting that the derived functions hold for MQs in the range 2 ≲ z ≲ 4.
-
Since high-redshift MQ progenitors can exhibit significant sub-millimetre emission at redshifts different from when they reach their peak, we show in Figure 2 the fraction of MQs that exceeded given S870 thresholds as a function of redshift. Sub-millimetre emission was most prevalent at z ∼ 3.4, 4.3, and 5.5 for MQs selected at z = 2, 3, and 4, respectively. At these epochs, approximately 50%, 66%, and 67% of the MQs at the previously mentioned redshifts, exceeded 1 mJy.
-
Although z ∼ 3.4, 4.3, and 5.5 were the redshifts when most MQ progenitors were sub-millimetre bright, only a small fraction of the broader populations of DSFGs at those redshifts are progenitors of MQs at z = 2, 3, and 4 (Figure 6). While the brightest DSFGS begin to quench earlier, on average, the majority of DSFGs tend to quench at z ≲ 2.
-
The evolution of stellar mass growth through secular star formation, merger accretion, and merger-induced starbursts (Figure 7) indicates that while sub-millimetre emission is mostly driven by secular star formation, the highest S870 values are more closely associated with mergers and starbursts.
-
MQ progenitors typically experience a major merger earlier than normal DSFGs (see Figure 7). Within the L-Galaxies framework, this early merger is responsible for depleting the cold gas reservoir (by starburst and cold gas accretion of the supermassive black hole) and initiating the quenching process (mostly driven by AGN feedback).
-
Our model predicts that, following the extreme merger event, these galaxies predominantly grow through merger accretion without significant starbursts, i.e. through dry mergers.
-
Finally, we trace the median evolution of energy injection from supernovae and AGN feedback for the studied galaxy populations (Figure 8). Our results indicate that AGN feedback is the primary quenching mechanism in all cases. This AGN feedback is triggered earlier in high-redshift MQ progenitors due to mergers. While SN feedback plays a secondary role, it is essential for heating cold gas and preparing the conditions necessary for AGN activation.
These results offer predictions and a detailed theoretical framework for understanding the progenitors of massive quiescent galaxies at high redshift and their connection to dusty star-forming galaxies. We find that high-redshift MQs were, in most cases, previously DSFGs. However, most DSFGs only quench at z ≲ 2. The key distinction between high-redshift MQ progenitors and the broader DSFG population lies in the timing of the first significant merger event, which triggers AGN activity and ultimately quenches star formation.
Acknowledgments
We thank the anonymous referee for constructive comments that helped improve the clarity of this work. PA-A thanks the Coordenação de Aperfeiçoamento de Pessoal de Nível Superior – Brasil (CAPES), for supporting his PhD scholarship (project 88882.332909/2020-01). RKC is grateful for support from the Leverhulme Trust via the Leverhulme Early Career Fellowship. The model calibration was run on computing cluster facilities provided by the Flatiron Institute. The Flatiron Institute is supported by the Simons Foundation. LSJ acknowledges the support from CNPq (308994/2021-3) and FAPESP (2011/51680-6). MCV acknowledges the FAPESP for supporting his PhD (2021/06590-0). PA-A and BG acknowledge support from the Independent Research Fund Denmark (DFF) under grant 4251-00086B. FV acknowledges support from the DFF under grant 3120-00043B.
References
- Alberts, S., Williams, C. C., Helton, J. M., et al. 2024, ApJ, 975, 85 [Google Scholar]
- Angulo, R. E., & Hilbert, S. 2015, MNRAS, 448, 364 [CrossRef] [Google Scholar]
- Araya-Araya, P., Cochrane, R. K., Hayward, C. C., et al. 2024, ApJ, 977, 204 [Google Scholar]
- Araya-Araya, P., Cochrane, R. K., Hayward, C. C., et al. 2025, MNRAS, 542, 2808 [Google Scholar]
- Ayromlou, M., Kauffmann, G., Yates, R. M., Nelson, D., & White, S. D. M. 2021, MNRAS, 505, 492 [NASA ADS] [CrossRef] [Google Scholar]
- Baker, W. M., Lim, S., D’Eugenio, F., et al. 2025, MNRAS, 539, 557 [Google Scholar]
- Calderón-Castillo, P., & Smith, R. 2024, A&A, 691, A82 [NASA ADS] [CrossRef] [EDP Sciences] [Google Scholar]
- Carnall, A. C., Walker, S., McLure, R. J., et al. 2020, MNRAS, 496, 695 [Google Scholar]
- Carnall, A. C., McLeod, D. J., McLure, R. J., et al. 2023a, MNRAS, 520, 3974 [NASA ADS] [CrossRef] [Google Scholar]
- Carnall, A. C., McLure, R. J., Dunlop, J. S., et al. 2023b, Nature, 619, 716 [NASA ADS] [CrossRef] [Google Scholar]
- Carnall, A. C., Cullen, F., McLure, R. J., et al. 2024, MNRAS, 534, 325 [NASA ADS] [CrossRef] [Google Scholar]
- Casey, C. M., Narayanan, D., & Cooray, A. 2014, Phys. Rep., 541, 45 [Google Scholar]
- Chabrier, G. 2003, PASP, 115, 763 [Google Scholar]
- Cochrane, R. K., Hayward, C. C., Anglés-Alcázar, D., et al. 2019, MNRAS, 488, 1779 [NASA ADS] [CrossRef] [Google Scholar]
- Cochrane, R. K., Hayward, C. C., & Anglés-Alcázar, D. 2022, ApJ, 939, L27 [Google Scholar]
- Cochrane, R. K., Hayward, C. C., Anglés-Alcázar, D., & Somerville, R. S. 2023a, MNRAS, 518, 5522 [Google Scholar]
- Cochrane, R. K., Anglés-Alcázar, D., Mercedes-Feliz, J., et al. 2023b, MNRAS, 523, 2409 [NASA ADS] [CrossRef] [Google Scholar]
- Cochrane, R. K., Anglés-Alcázar, D., Cullen, F., & Hayward, C. C. 2024, ApJ, 961, 37 [NASA ADS] [CrossRef] [Google Scholar]
- Cowley, W. I., Lacey, C. G., Baugh, C. M., et al. 2019, MNRAS, 487, 3082 [NASA ADS] [CrossRef] [Google Scholar]
- Croton, D. J., Springel, V., White, S. D. M., et al. 2006, MNRAS, 365, 11 [Google Scholar]
- Daddi, E., Bournaud, F., Walter, F., et al. 2010, ApJ, 713, 686 [NASA ADS] [CrossRef] [Google Scholar]
- De Lucia, G., Fontanot, F., Xie, L., & Hirschmann, M. 2024, A&A, 687, A68 [NASA ADS] [CrossRef] [EDP Sciences] [Google Scholar]
- Decarli, R., Falomo, R., Treves, A., et al. 2010a, MNRAS, 402, 2441 [NASA ADS] [CrossRef] [Google Scholar]
- Decarli, R., Falomo, R., Treves, A., et al. 2010b, MNRAS, 402, 2453 [CrossRef] [Google Scholar]
- D’Eugenio, C., Daddi, E., Gobat, R., et al. 2020, ApJ, 892, L2 [Google Scholar]
- Dudzevičiūtė, U., Smail, I., Swinbank, A. M., et al. 2020, MNRAS, 494, 3828 [Google Scholar]
- Dwek, E. 1998, ApJ, 501, 643 [NASA ADS] [CrossRef] [Google Scholar]
- Ellison, S. L., Wilkinson, S., Woo, J., et al. 2022, MNRAS, 517, L92 [NASA ADS] [CrossRef] [Google Scholar]
- Ellison, S., Ferreira, L., Wild, V., et al. 2024, Open J. Astrophys., 7, 121 [Google Scholar]
- Fontana, A., Santini, P., Grazian, A., et al. 2009, A&A, 501, 15 [NASA ADS] [CrossRef] [EDP Sciences] [Google Scholar]
- Fontanot, F., De Lucia, G., Hirschmann, M., et al. 2020, MNRAS, 496, 3943 [CrossRef] [Google Scholar]
- Forrest, B., Marsan, Z. C., Annunziatella, M., et al. 2020, ApJ, 903, 47 [NASA ADS] [CrossRef] [Google Scholar]
- Glazebrook, K., Schreiber, C., Labbé, I., et al. 2017, Nature, 544, 71 [Google Scholar]
- Glazebrook, K., Nanayakkara, T., Schreiber, C., et al. 2024, Nature, 628, 277 [NASA ADS] [CrossRef] [Google Scholar]
- Gordon, A. J., Ferguson, A. M. N., Mann, R. G., & Wild, V. 2026, MNRAS, 545, staf2223 [Google Scholar]
- Greene, J. E., Strader, J., & Ho, L. C. 2020, ARA&A, 58, 257 [Google Scholar]
- Greene, J. E., Labbe, I., Goulding, A. D., et al. 2024, ApJ, 964, 39 [CrossRef] [Google Scholar]
- Hayward, C. C., Sparre, M., Chapman, S. C., et al. 2021, MNRAS, 502, 2922 [Google Scholar]
- Henriques, B. M. B., White, S. D. M., Thomas, P. A., et al. 2013, MNRAS, 431, 3373 [NASA ADS] [CrossRef] [Google Scholar]
- Henriques, B. M. B., Yates, R. M., Fu, J., et al. 2020, MNRAS, 491, 5795 [NASA ADS] [CrossRef] [Google Scholar]
- Hough, R. T., Rennehan, D., Kobayashi, C., et al. 2023, MNRAS, 525, 1061 [NASA ADS] [CrossRef] [Google Scholar]
- Hough, R. T., Shao, Z., Cui, W., et al. 2024, MNRAS, 532, 476 [Google Scholar]
- Ito, K., Tanaka, M., Miyaji, T., et al. 2022, ApJ, 929, 53 [NASA ADS] [CrossRef] [Google Scholar]
- Ito, K., Tanaka, M., Valentino, F., et al. 2023, ApJ, 945, L9 [NASA ADS] [CrossRef] [Google Scholar]
- Izquierdo-Villalba, D., Sesana, A., Bonoli, S., & Colpi, M. 2022, MNRAS, 509, 3488 [Google Scholar]
- Kubo, M., Umehata, H., Matsuda, Y., et al. 2021, ApJ, 919, 6 [NASA ADS] [CrossRef] [Google Scholar]
- Kubo, M., Umehata, H., Matsuda, Y., et al. 2022, ApJ, 935, 89 [NASA ADS] [CrossRef] [Google Scholar]
- Kurinchi-Vendhan, S., Farcy, M., Hirschmann, M., & Valentino, F. 2024, MNRAS, 534, 3974 [NASA ADS] [CrossRef] [Google Scholar]
- Labbé, I., van Dokkum, P., Nelson, E., et al. 2023, Nature, 616, 266 [CrossRef] [Google Scholar]
- Lacey, C. G., Baugh, C. M., Frenk, C. S., et al. 2016, MNRAS, 462, 3854 [Google Scholar]
- Lagos, C. D. P., Tobar, R. J., Robotham, A. S. G., et al. 2018, MNRAS, 481, 3573 [CrossRef] [Google Scholar]
- Lagos, C. D. P., Robotham, A. S. G., Trayford, J. W., et al. 2019, MNRAS, 489, 4196 [NASA ADS] [CrossRef] [Google Scholar]
- Lagos, C. D. P., Bravo, M., Tobar, R., et al. 2024, MNRAS, 531, 3551 [CrossRef] [Google Scholar]
- Lagos, C. D. P., Valentino, F., Wright, R. J., et al. 2025, MNRAS, 536, 2324 [Google Scholar]
- Leja, J., Speagle, J. S., Johnson, B. D., et al. 2020, ApJ, 893, 111 [Google Scholar]
- Leja, J., Speagle, J. S., Ting, Y.-S., et al. 2022, ApJ, 936, 165 [NASA ADS] [CrossRef] [Google Scholar]
- Li, Z., Inayoshi, K., Chen, K., Ichikawa, K., & Ho, L. C. 2025, ApJ, 980, 36 [Google Scholar]
- Long, A. S., Antwi-Danso, J., Lambrides, E. L., et al. 2024, ApJ, 970, 68 [Google Scholar]
- Lovell, C. C., Geach, J. E., Davé, R., Narayanan, D., & Li, Q. 2021, MNRAS, 502, 772 [NASA ADS] [CrossRef] [Google Scholar]
- Marchesini, D., Whitaker, K. E., Brammer, G., et al. 2010, ApJ, 725, 1277 [NASA ADS] [CrossRef] [Google Scholar]
- Marsan, Z. C., Marchesini, D., Brammer, G. B., et al. 2017, ApJ, 842, 21 [Google Scholar]
- Matthee, J., Naidu, R. P., Brammer, G., et al. 2024, ApJ, 963, 129 [NASA ADS] [CrossRef] [Google Scholar]
- McAlpine, S., Smail, I., Bower, R. G., et al. 2019, MNRAS, 488, 2440 [NASA ADS] [CrossRef] [Google Scholar]
- McConachie, I., Wilson, G., Forrest, B., et al. 2022, ApJ, 926, 37 [NASA ADS] [CrossRef] [Google Scholar]
- Merlin, E., Fortuni, F., Torelli, M., et al. 2019, MNRAS, 490, 3309 [CrossRef] [Google Scholar]
- Nanayakkara, T., Esdaile, J., Glazebrook, K., et al. 2022, PASA, 39, e002 [NASA ADS] [CrossRef] [Google Scholar]
- Nanayakkara, T., Glazebrook, K., Jacobs, C., et al. 2024, Sci. Rep., 14, 3724 [NASA ADS] [CrossRef] [Google Scholar]
- Nanayakkara, T., Glazebrook, K., Schreiber, C., et al. 2025, ApJ, 981, 78 [Google Scholar]
- Park, M., Belli, S., Conroy, C., et al. 2024, ApJ, 976, 72 [Google Scholar]
- Planck Collaboration XVI. 2014, A&A, 571, A16 [NASA ADS] [CrossRef] [EDP Sciences] [Google Scholar]
- Poitevineau, R., Castignani, G., & Combes, F. 2023, A&A, 672, A164 [NASA ADS] [CrossRef] [EDP Sciences] [Google Scholar]
- Reines, A. E., & Volonteri, M. 2015, ApJ, 813, 82 [NASA ADS] [CrossRef] [Google Scholar]
- Schawinski, K., Koss, M., Berney, S., & Sartori, L. F. 2015, MNRAS, 451, 2517 [Google Scholar]
- Schreiber, C., Glazebrook, K., Nanayakkara, T., et al. 2018, A&A, 618, A85 [NASA ADS] [CrossRef] [EDP Sciences] [Google Scholar]
- Shi, K., Toshikawa, J., Lee, K.-S., et al. 2021, ApJ, 911, 46 [NASA ADS] [CrossRef] [Google Scholar]
- Simpson, J. M., Smail, I., Swinbank, A. M., et al. 2017, ApJ, 839, 58 [NASA ADS] [CrossRef] [Google Scholar]
- Spinoso, D., Bonoli, S., Valiante, R., Schneider, R., & Izquierdo-Villalba, D. 2023, MNRAS, 518, 4672 [Google Scholar]
- Spitler, L. R., Straatman, C. M. S., Labbé, I., et al. 2014, ApJ, 787, L36 [NASA ADS] [CrossRef] [Google Scholar]
- Springel, V. 2005, MNRAS, 364, 1105 [Google Scholar]
- Springel, V., White, S. D. M., Tormen, G., & Kauffmann, G. 2001, MNRAS, 328, 726 [Google Scholar]
- Stach, S. M., Smail, I., Swinbank, A. M., et al. 2018, ApJ, 860, 161 [Google Scholar]
- Stach, S. M., Dudzevičiūtė, U., Smail, I., et al. 2019, MNRAS, 487, 4648 [Google Scholar]
- Stefanon, M., Marchesini, D., Muzzin, A., et al. 2015, ApJ, 803, 11 [CrossRef] [Google Scholar]
- Straatman, C. M. S., Labbé, I., Spitler, L. R., et al. 2014, ApJ, 783, L14 [NASA ADS] [CrossRef] [Google Scholar]
- Suh, H., Civano, F., Trakhtenbrot, B., et al. 2020, ApJ, 889, 32 [NASA ADS] [CrossRef] [Google Scholar]
- Szpila, J., Davé, R., Rennehan, D., Cui, W., & Hough, R. T. 2025, MNRAS, 537, 1849 [Google Scholar]
- Tacconi, L. J., Genzel, R., Neri, R., et al. 2010, Nature, 463, 781 [Google Scholar]
- Tanaka, M., Valentino, F., Toft, S., et al. 2019, ApJ, 885, L34 [Google Scholar]
- Toft, S., Smolčić, V., Magnelli, B., et al. 2014, ApJ, 782, 68 [Google Scholar]
- Valentino, F., Tanaka, M., Davidzon, I., et al. 2020, ApJ, 889, 93 [Google Scholar]
- Valentino, F., Brammer, G., Gould, K. M. L., et al. 2023, ApJ, 947, 20 [NASA ADS] [CrossRef] [Google Scholar]
- Vani, A., Ayromlou, M., Kauffmann, G., & Springel, V. 2025, MNRAS, 536, 777 [NASA ADS] [Google Scholar]
- Weller, E. J., Pacucci, F., Ni, Y., Hernquist, L., & Park, M. 2025, ApJ, 979, 181 [Google Scholar]
- Wilkinson, A., Almaini, O., Chen, C.-C., et al. 2017, MNRAS, 464, 1380 [NASA ADS] [CrossRef] [Google Scholar]
- Xie, L., De Lucia, G., Fontanot, F., et al. 2024, ApJ, 966, L2 [NASA ADS] [CrossRef] [Google Scholar]
- Yang, T., Wang, T., Xu, K., et al. 2025, ArXiv e-prints [arXiv:2510.12235] [Google Scholar]
- Yates, R. M., Henriques, B. M. B., Fu, J., et al. 2021, MNRAS, 503, 4474 [NASA ADS] [CrossRef] [Google Scholar]
- Yates, R. M., Hendriks, D., Vijayan, A. P., et al. 2024, MNRAS, 527, 6292 [Google Scholar]
Model calibrated without using the neutral hydrogen mass function as an observational constraint; see Section 2 for a detailed description.
See Appendix A for a detailed description of how these quantities are calculated.
In fact, the SMBH–related processes prescription adopted in GAEA builds on the Croton et al. (2006) framework (Fontanot et al. 2020), but additionally includes cold gas accretion as a channel for SMBH growth, as well as AGN-driven winds that directly affect the cold gas in galaxy disks.
Appendix A: Energy input due to feedback
The energy inputs due to SN and AGN feedback, ΔESN and ΔEAGN, (see Figure 8), are not direct outputs from L-Galaxies; however, they can be easily derived from other properties. To calculate the energy input from SN feedback, we use the outputs ReheatingRate (ΔMreheat) and EjectionRate (ΔMeject), which correspond to the mass rates of reheated and ejected gas, respectively. It is important to note that, in L-Galaxies, ejection occurs only if there is remaining energy after reheating. The total energy input is then given by Equation A.1 (adapted from Equation S23 in the Supplementary Material of Henriques et al. (2020)),
 (A.1)
(A.1)
where V200c is the halo virial velocity.
The AGN feedback in the Henriques et al. (2020) version of L-Galaxies is based on the Croton et al. (2006) model. To obtain the energy input due to AGN feedback, we first estimate the accretion using Equation A.2:
 (A.2)
(A.2)
Here kAGN is a free parameter ( in the recalibrated model used in this work), Mhot is the mass of hot gas, and MBH is the supermassive black hole mass. Finally, the energy input due to AGN feedback is given by ΔEAGN = η ΔMBH c2 (Equation S29 in the Supplementary Material of Henriques et al. (2020)), where η = 0.1 and c is the speed of light.
Appendix B: Timescales between the peak of sub-millimetre emission and subsequent quenching
Figure 10 shows the distribution of timescales between the sub-millimetre emission peak (tsubmm − peak) and subsequent quenching (tquench) for DSFGs and MQ progenitors at z = 3.4, 4.3, and 5.5. For visualisation purposes, Figure B.1 presents a zoom-in view of Figure 10, focusing exclusively on MQs selected at z = 2, 3, and 4. The main trend observed in Figure B.1 is that, on average, MQs at higher redshifts quench more rapidly after reaching their sub-millimetre peak than those identified at lower redshifts.
We find that the median tquench − tsubmm − peak timescales are 0.9 Gyr, 0.6 Gyr, and 0.4 Gyr, for MQs selected at z = 2, 3, and 4, respectively.
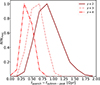 |
Fig. B.1. Zoomed-in version of Figure 10, showing only massive quenched galaxies at z = 2, 3, and 4. The time between the peak in sub-millimetre flux density and subsequent quenching is lowest for the highest-redshift MQs, on average. The median tquench − tsubmm − peak timescales are 0.9 Gyr, 0.6 Gyr, and 0.4 Gyr for MQs selected at z = 2, 3, and 4, respectively. |
Appendix C: MBH-M★ relation
For completeness and as a sanity check, we present in Figure C.1 the MBH − M★ relation for the ‘no HIMF’ model of Araya-Araya et al. (2025) at z = 0 and z = 3. At z = 0, we compare our predictions with the observational relations from Reines & Volonteri (2015) and Greene et al. (2020). The observational estimates from Decarli et al. (2010a, b), Suh et al. (2020) and Poitevineau et al. (2023) at 2.0 < z < 3.5 are compared against our predictions at z = 3.
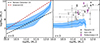 |
Fig. C.1. MBH − M★ relation at z = 0 (left) and 3 (right) as predicted by the no HIMF recalibrated model (Araya-Araya et al. 2025). The light blue areas and lines represent the 16th, 50th, and 84th percentiles of all galaxies in the simulated box. The black and red dashed lines indicate the MBH − M★ relations derived from observations by Reines & Volonteri (2015) and Greene et al. (2020), respectively. The predictions at z = 3 are compared to observational estimates from Decarli et al. (2010a, b) (black dots), Suh et al. (2020) (grey squares) and Poitevineau et al. (2023) (purple diamonds). |
All Tables
All Figures
|
Fig. 1. Star formation rate (SFR)–stellar mass (M★) relation at z = 2, 3, and 4 is shown in the first, second, and third panels, respectively, using the recalibrated version of L-Galaxies from Araya-Araya et al. (2025). The dots represent bright DSFGs with S870 ≥ 1 mJy, colour-coded by their S870 flux density (see colour-bar), derived using the scaling relations presented by Cochrane et al. (2023a). The red dashed lines indicate the thresholds in specific star formation rate and stellar mass used to separate quenched and massive galaxies, respectively, following the definition of Carnall et al. (2020). The pink line and coloured area correspond to the main sequence of galaxies in our model and its 1σ dispersion. Overall, bright DSFGs are located in the massive, star-forming region in the diagram and lie on, or just above, the main sequence. As expected, the massive, quenched region is less populated at higher redshifts. |
| In the text | |
|
Fig. 2. Evolution of the S870 flux density of massive quiescent galaxies (MQs) selected at z = 2, 3, and 4 is shown in the first, second, and third panel, respectively. At each selected redshift, MQs are divided into four stellar mass bins of width 0.4 dex, starting from a lower limit of log(M★/M⊙) = 10.6. The coloured regions and lines represent the 16th, 50th, and 84th percentiles of MQs within each stellar mass bin. Overall, the S870 evolution of MQs exhibits a gradual increase with decreasing redshift, reaching a peak before undergoing a rapid decline at later times. Notably, the most massive MQs consistently display the highest S870 peak values. |
| In the text | |
|
Fig. 3. Distribution of the maximum S870 flux density reached by each modelled galaxy across its entire formation history, S870, max (first row), and when it occurred (second row; redshift distribution), for massive quiescent galaxies (MQs) selected at z = 2, 3, and 4 (from left to right). The minimum S870, max reached by any of the MQs is indicated by the vertical dashed black line. |
| In the text | |
|
Fig. 4. Maximum value of S870, S870, max, reached across the formation history of massive quiescent galaxies (MQs), as a function of stellar mass at redshifts z = 2, 3, and 4 (from left to right). The data points are coloured according to the redshift at which S870, max occurred, z(S870, max). A strong correlation is found between the stellar mass of MQs and their S870, max, with a dispersion that also correlates with z(S870, max). At fixed stellar mass, MQs that reached S870, max at earlier times tended to exhibit brighter S870 flux densities. |
| In the text | |
|
Fig. 5. Fraction of massive quiescent galaxy (selected at z = 2, 3, and 4; first, second, and third panel, respectively) progenitors that exceed S870 flux densities of 1 mJy (dark blue), 3 mJy (purple), and 5 mJy (orange) vs redshift. At the redshift at which the distributions peak, a significant fraction of MQ progenitors exceed S870 = 1 mJy. For example, 50%, 66%, and 67% of MQs selected at z = 2, 3, and 4, respectively, exceeded S870 = 1 mJy at z ∼ 3.4, 4.3, and 5.5. These numbers are lower for higher S870 thresholds: at their peaks, ∼3% of MQs selected at z = 2, ∼6% at z = 3, and ∼5% at z = 4 exceed 3 mJy. |
| In the text | |
|
Fig. 6. Cumulative fraction of dusty star-forming galaxies (DSFGs) selected at z = 3.4, 4.3, and 5.5 (from left to right) that become massive and quiescent as a function of redshift. The dark blue, purple, and orange lines represent DSFGs with sub-millimetre flux densities of 1 < S870/mJy ≤ 3, 3 < S870/mJy ≤ 5, and S870/mJy > 5, respectively. The grey line indicates the fraction of DSFGs that were accreted by a more massive galaxy. We note that all DSFGs with S870 ≳ 3 mJy are already massive at all selection redshifts. The most remarkable trend is that brighter DSFGs quench more rapidly than their fainter counterparts. For example, 50% of the bright DSFGs selected at z = 3.4, 4.3, and 5.5 become quenched by z ∼ 1.85, 2.08, and 2.54, respectively. In contrast, the fainter DSFGs across all selected redshifts tend to quench later, with similar quenched redshift, typically around z ∼ 1.3. This is because faint DSFGs selected at high redshift may continue to grow and potentially become brighter at later times. |
| In the text | |
|
Fig. 7. Median stellar mass evolution attributed to secular processes (in situ, top panels), accretion via mergers (mergers, middle panels), and merger-induced starbursts (burst, bottom panels) for massive quiescent progenitors (solid red line) the bright (dashed orange line), intermediate (purple dashed lines), and faint DSFGs (dark blue dashed lines). From left to right we show DSFG and MQ progenitors selected at z = 3.4, 4.3, and 5.5. The dots, diamonds, and crosses highlight the median redshifts at which the galaxy population exceeded S870 > 1 mJy for the first time, reaches the sub-millimetre peak, and quenches. The formation of all four galaxy populations is initially dominated by secular star formation, suggesting that sub-millimetre emission is not primarily triggered by mergers at early times. The main difference in stellar mass growth between typical DSFGs and MQ progenitors lies in the timing of major mergers. MQ progenitors experience a significant merger event earlier, which induces an extreme starburst and rapid SMBH-driven cold gas accretion, thereby depleting the available gas for continued secular star formation. Following this early violent merger, these galaxies grow their stellar mass primarily through dry mergers. |
| In the text | |
|
Fig. 8. Evolution of the median energy input rate from supernovae (SN; top panels) and active galactic nuclei (AGN; bottom panels) for massive quiescent progenitors (red solid lines), faint (dark blue dashed lines), intermediate (purple dashed lines), and bright (orange dashed lines) dusty star-forming galaxies selected at z = 3.4 (left panel), z = 4.3 (central panel), and z = 5.5 (right panel), the redshifts at which the majority of MQs at z = 2, 3, and 4, were DSFGs. The crosses indicate the median redshift at which a given galaxy population first satisfied the quiescent criteria (sSFR ≤ 0.2/tobs(z)). The energy input from AGN feedback rises rapidly close to the quenching epoch, dominating the energy injection rate over SN feedback by at least two orders of magnitude. This suggests that AGN feedback is the main mechanism that quenches the star formation in the four populations, but that this happens earlier for MQs. |
| In the text | |
|
Fig. 9. Evolution of the median supermassive black hole mass (MBH) to stellar mass (M★) ratio for MQ progenitors (red solid line), and for faint (dark blue dashed line), intermediate (purple dashed line), and bright (orange dashed line) DSFGs selected at z = 3.4 (left panel), z = 4.3 (central panel), and z = 5.5 (right panel), the typical redshifts at which MQs at z = 2, 3, and 4, respectively, exceeded at least 1 mJy. The crosses and their error bars indicate the median, along with the 16th and 84th percentiles, of the redshift at which each galaxy population quenched. DSFGs, independently of selection redshift or sub-millimetre flux density, exhibit a similar MBH/M★ ratio at the time of quenching (log(MBH/M★)∼ − 3.75). In contrast, MQs host more massive SMBHs relative to their stellar mass at the time of quenching, even though the overall energy input from AGN is typically lower (see Figure 8), and reflects the lower stellar masses of the highest-redshift MQs at the time of quenching. In summary, in our model, rapid growth of a black hole triggered by an early galaxy-galaxy merger produces a black hole that is overmassive and sufficiently energetic to maintain the quenched state of the galaxy. |
| In the text | |
|
Fig. 10. Distribution of timescales between the sub-millimetre peak (S870, max) and subsequent quenching is shown for massive quiescent (MQ) progenitors (solid red histogram), and for faint (dark blue dashed), intermediate (purple dashed), and bright (orange dashed) dusty star-forming galaxies (DSFGs) selected at z = 3.4 (first panel), 4.3 (second panel), and 5.5 (third panel), the typical redshifts at which MQs at z = 2, 3, and 4, respectively, were in a DSFG phase. The timescale distributions for DSFGs exhibit similar peaks, although faint DSFGs show greater dispersion, with tails towards longer timescales. At z = 5.5, bright DSFGs present shorter timescales than their analogues at lower redshifts. MQ progenitors show systematically shorter timescales than DSFGs, with durations increasing for MQs selected at lower redshifts. A zoomed-in version of the MQ timescale distribution is shown in Figure B.1. |
| In the text | |
|
Fig. B.1. Zoomed-in version of Figure 10, showing only massive quenched galaxies at z = 2, 3, and 4. The time between the peak in sub-millimetre flux density and subsequent quenching is lowest for the highest-redshift MQs, on average. The median tquench − tsubmm − peak timescales are 0.9 Gyr, 0.6 Gyr, and 0.4 Gyr for MQs selected at z = 2, 3, and 4, respectively. |
| In the text | |
|
Fig. C.1. MBH − M★ relation at z = 0 (left) and 3 (right) as predicted by the no HIMF recalibrated model (Araya-Araya et al. 2025). The light blue areas and lines represent the 16th, 50th, and 84th percentiles of all galaxies in the simulated box. The black and red dashed lines indicate the MBH − M★ relations derived from observations by Reines & Volonteri (2015) and Greene et al. (2020), respectively. The predictions at z = 3 are compared to observational estimates from Decarli et al. (2010a, b) (black dots), Suh et al. (2020) (grey squares) and Poitevineau et al. (2023) (purple diamonds). |
| In the text | |
Current usage metrics show cumulative count of Article Views (full-text article views including HTML views, PDF and ePub downloads, according to the available data) and Abstracts Views on Vision4Press platform.
Data correspond to usage on the plateform after 2015. The current usage metrics is available 48-96 hours after online publication and is updated daily on week days.
Initial download of the metrics may take a while.