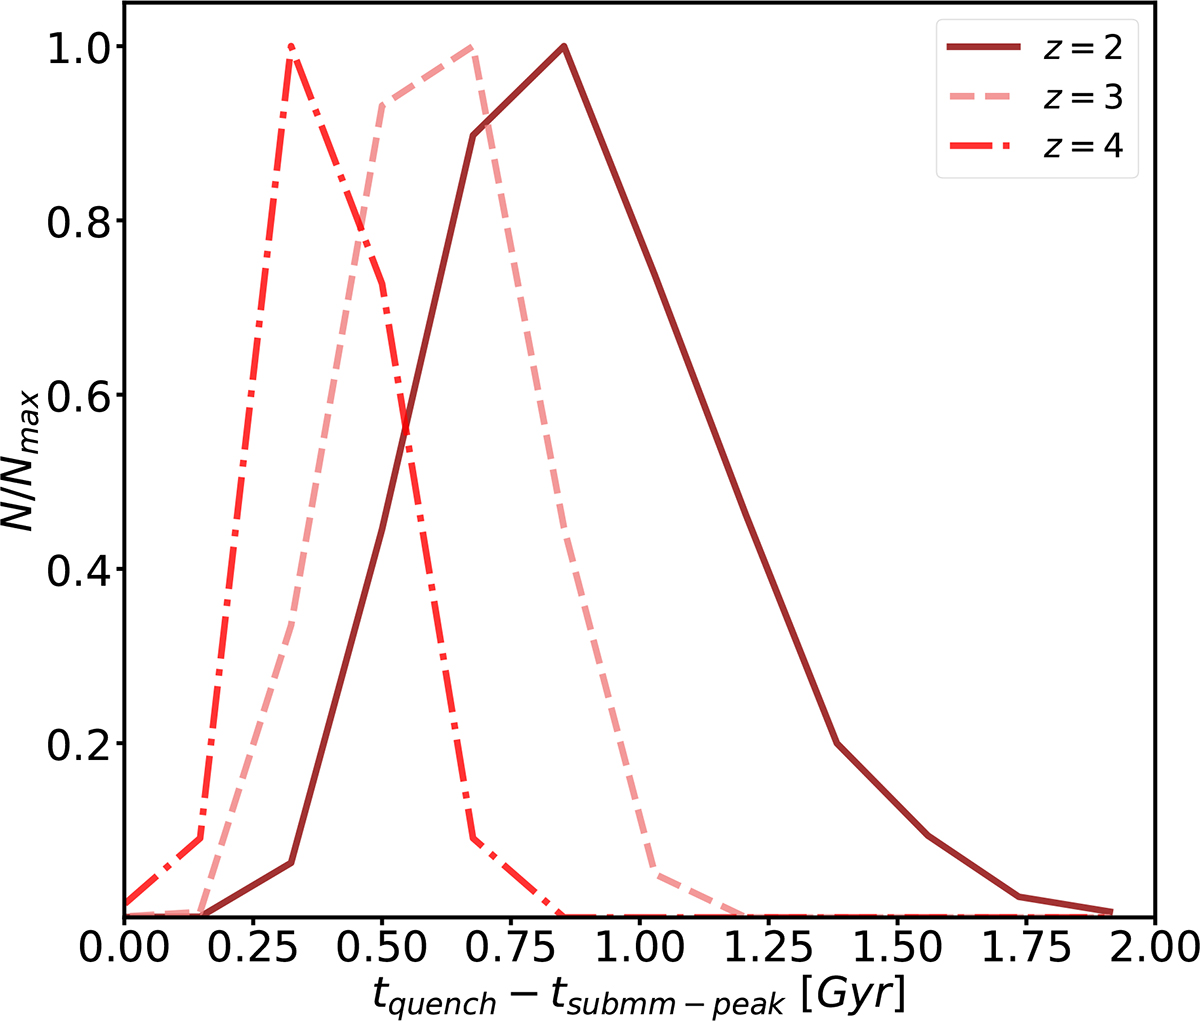
Fig. B.1.
Download original image
Zoomed-in version of Figure 10, showing only massive quenched galaxies at z = 2, 3, and 4. The time between the peak in sub-millimetre flux density and subsequent quenching is lowest for the highest-redshift MQs, on average. The median tquench − tsubmm − peak timescales are 0.9 Gyr, 0.6 Gyr, and 0.4 Gyr for MQs selected at z = 2, 3, and 4, respectively.
Current usage metrics show cumulative count of Article Views (full-text article views including HTML views, PDF and ePub downloads, according to the available data) and Abstracts Views on Vision4Press platform.
Data correspond to usage on the plateform after 2015. The current usage metrics is available 48-96 hours after online publication and is updated daily on week days.
Initial download of the metrics may take a while.