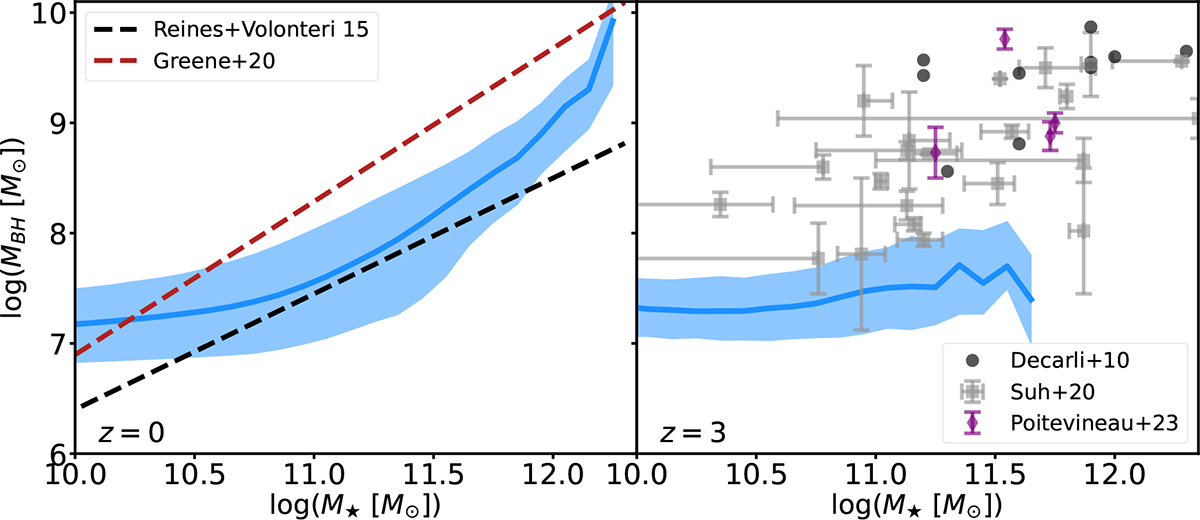
Fig. C.1.
Download original image
MBH − M★ relation at z = 0 (left) and 3 (right) as predicted by the no HIMF recalibrated model (Araya-Araya et al. 2025). The light blue areas and lines represent the 16th, 50th, and 84th percentiles of all galaxies in the simulated box. The black and red dashed lines indicate the MBH − M★ relations derived from observations by Reines & Volonteri (2015) and Greene et al. (2020), respectively. The predictions at z = 3 are compared to observational estimates from Decarli et al. (2010a, b) (black dots), Suh et al. (2020) (grey squares) and Poitevineau et al. (2023) (purple diamonds).
Current usage metrics show cumulative count of Article Views (full-text article views including HTML views, PDF and ePub downloads, according to the available data) and Abstracts Views on Vision4Press platform.
Data correspond to usage on the plateform after 2015. The current usage metrics is available 48-96 hours after online publication and is updated daily on week days.
Initial download of the metrics may take a while.