Fig. 2.
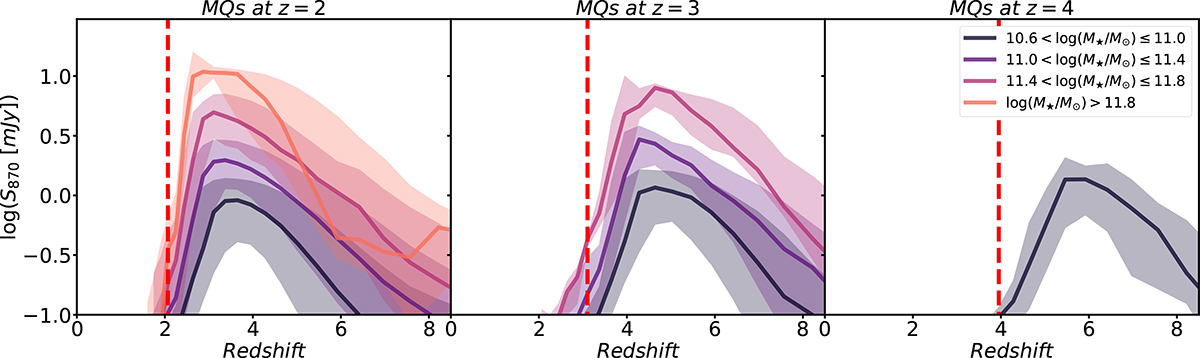
Download original image
Evolution of the S870 flux density of massive quiescent galaxies (MQs) selected at z = 2, 3, and 4 is shown in the first, second, and third panel, respectively. At each selected redshift, MQs are divided into four stellar mass bins of width 0.4 dex, starting from a lower limit of log(M★/M⊙) = 10.6. The coloured regions and lines represent the 16th, 50th, and 84th percentiles of MQs within each stellar mass bin. Overall, the S870 evolution of MQs exhibits a gradual increase with decreasing redshift, reaching a peak before undergoing a rapid decline at later times. Notably, the most massive MQs consistently display the highest S870 peak values.
Current usage metrics show cumulative count of Article Views (full-text article views including HTML views, PDF and ePub downloads, according to the available data) and Abstracts Views on Vision4Press platform.
Data correspond to usage on the plateform after 2015. The current usage metrics is available 48-96 hours after online publication and is updated daily on week days.
Initial download of the metrics may take a while.