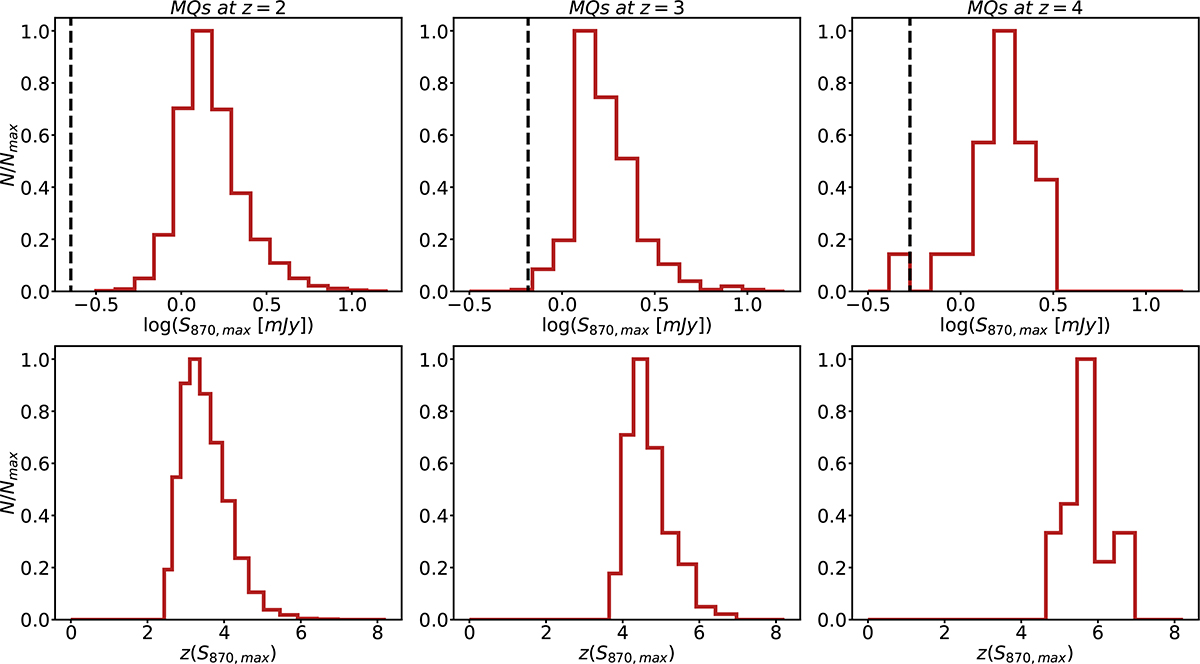
Fig. 3.
Download original image
Distribution of the maximum S870 flux density reached by each modelled galaxy across its entire formation history, S870, max (first row), and when it occurred (second row; redshift distribution), for massive quiescent galaxies (MQs) selected at z = 2, 3, and 4 (from left to right). The minimum S870, max reached by any of the MQs is indicated by the vertical dashed black line.
Current usage metrics show cumulative count of Article Views (full-text article views including HTML views, PDF and ePub downloads, according to the available data) and Abstracts Views on Vision4Press platform.
Data correspond to usage on the plateform after 2015. The current usage metrics is available 48-96 hours after online publication and is updated daily on week days.
Initial download of the metrics may take a while.