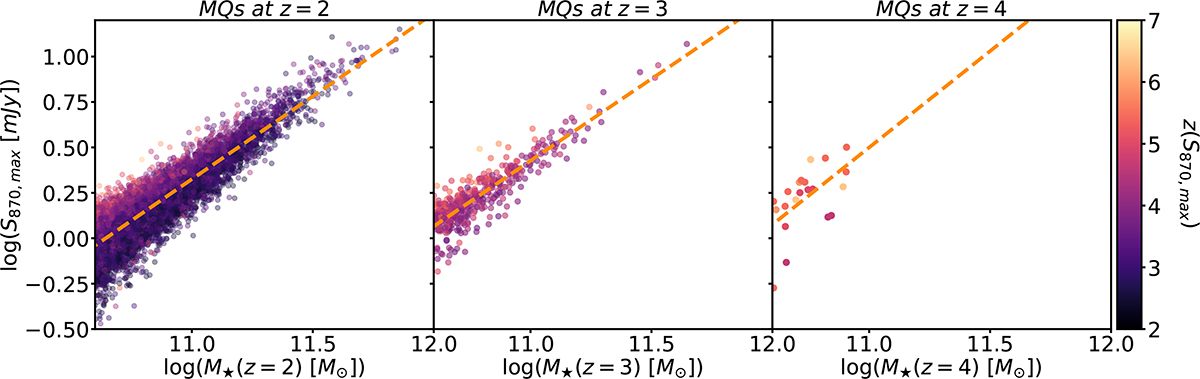
Fig. 4.
Download original image
Maximum value of S870, S870, max, reached across the formation history of massive quiescent galaxies (MQs), as a function of stellar mass at redshifts z = 2, 3, and 4 (from left to right). The data points are coloured according to the redshift at which S870, max occurred, z(S870, max). A strong correlation is found between the stellar mass of MQs and their S870, max, with a dispersion that also correlates with z(S870, max). At fixed stellar mass, MQs that reached S870, max at earlier times tended to exhibit brighter S870 flux densities.
Current usage metrics show cumulative count of Article Views (full-text article views including HTML views, PDF and ePub downloads, according to the available data) and Abstracts Views on Vision4Press platform.
Data correspond to usage on the plateform after 2015. The current usage metrics is available 48-96 hours after online publication and is updated daily on week days.
Initial download of the metrics may take a while.