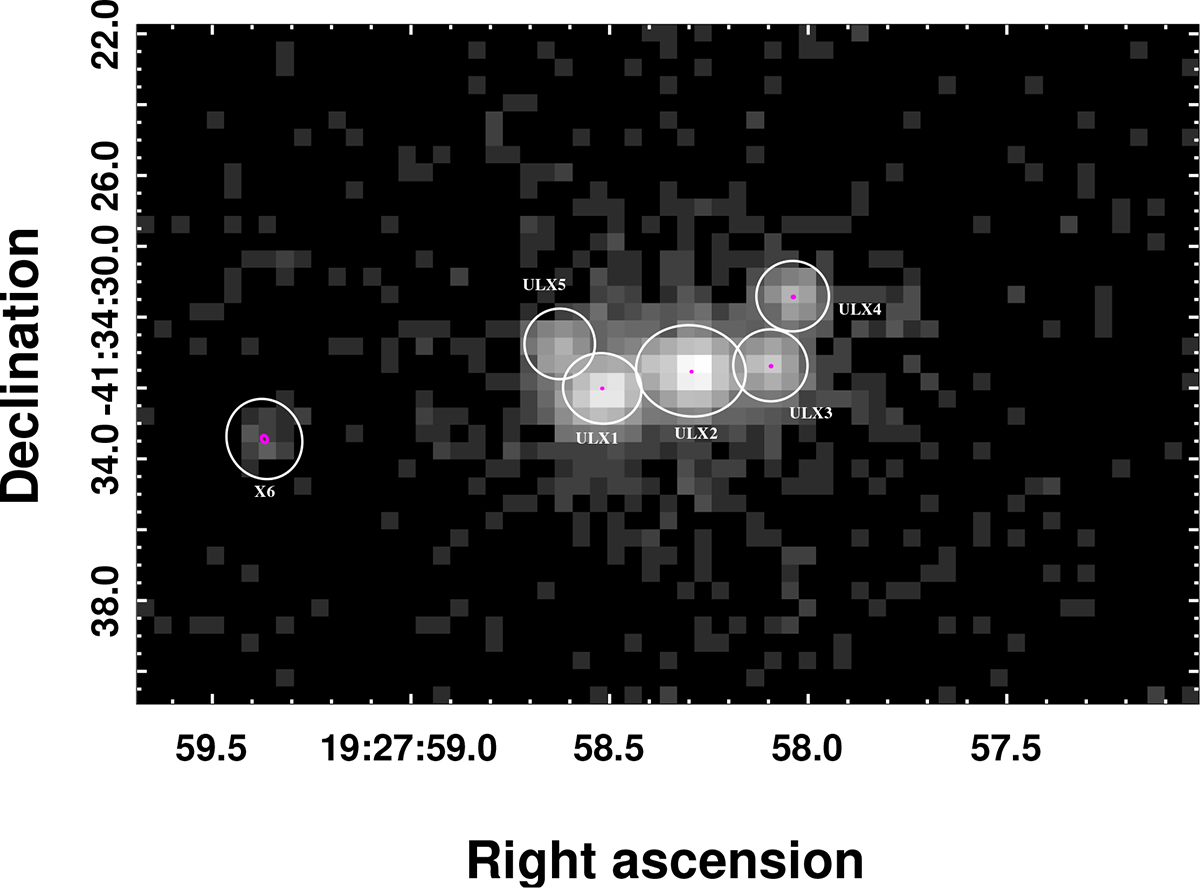
Fig. 1.
Download original image
Merged intensity image of the 16 Chandra observations analyzed in this work (the log of the observations is summarized in Appendix A). The observations were taken with the ACIS-I array, and the image is exposure corrected. We highlight the boundaries of the count distribution of each source at a 3σ level through white ellipses. The magenta ellipses present the source locations along with their 1σ uncertainty in position. ULX1-4 and X6 were detected by wavdetect, while ULX5 was manually added as described in the text.
Current usage metrics show cumulative count of Article Views (full-text article views including HTML views, PDF and ePub downloads, according to the available data) and Abstracts Views on Vision4Press platform.
Data correspond to usage on the plateform after 2015. The current usage metrics is available 48-96 hours after online publication and is updated daily on week days.
Initial download of the metrics may take a while.