| Issue |
A&A
Volume 707, March 2026
|
|
|---|---|---|
| Article Number | A356 | |
| Number of page(s) | 13 | |
| Section | Extragalactic astronomy | |
| DOI | https://doi.org/10.1051/0004-6361/202557428 | |
| Published online | 19 March 2026 | |
X-ray stellar feedback in low-metallicity starbursts
Insights from the template starburst galaxy ESO 338-IG04 and its halo★
1
Institute for Physics and Astronomy, University of Potsdam, Karl-Liebknecht-Str. 24/25, 14476 Potsdam, Germany
2
Department of Physics, University of Arkansas, 226 Physics Building, 825 West Dickson Street, Fayetteville, AR 72701, USA
3
Arkansas Center for Space and Planetary Sciences, University of Arkansas, 332 N. Arkansas Avenue, Fayetteville, AR 72701, USA
4
Department of Astronomy, The Oskar Klein Centre, Stockholm University, AlbaNova, SE-10691 Stockholm, Sweden
5
Centro de Astrobiología (CAB), INTA–CSIC, Madrid, Spain
6
Department of Astronomy, U. Wisconsin-Madison, 475 N. Charter St., Madison, WI 53706, USA
7
ESA, ESAC, Apartado 78, 28691 Villanueva de la Cañada, Madrid, Spain
★★ Corresponding author: This email address is being protected from spambots. You need JavaScript enabled to view it.
Received:
26
September
2025
Accepted:
5
February
2026
Abstract
Context. The X-ray output of low-metallicity starburst galaxies is a key component of stellar feedback, tracing the processes responsible for gas ionization and chemical enrichment. The integrated X-ray luminosity (LX) from high-mass X-ray binaries in star-forming galaxies scales with the star formation rate (SFR) and the host galaxy metallicity Z. Due to the inverse correlation between LX/SFR and Z, the contribution of X-ray binaries to the ionizing photon budget is expected to be enhanced in metal-poor systems. Their radiation can potentially ionize He II in the surrounding interstellar medium, powering nebular He IIλ4686 Å emission. However, detailed studies of the X-ray emission in individual low-Z starburst galaxies are rare, and their X-ray properties are not well explored.
Aims. The blue compact dwarf galaxy ESO 338-IG04 (ESO 338-4 hereafter) serves as a nearby template for studying stellar feedback and X-ray emission in low-metallicity starbursts. It combines vigorous recent star formation, a low metallicity (12 + log(O/H)≈7.9, or 12% solar), and a rich population of massive stellar clusters. Extensively observed in optical and UV wavelengths with HST and VLT MUSE, ESO 338-4 is ideally suited for multiwavelength feedback studies. We characterize the X-ray emission of ESO 338-4 and its galactic halo using new deep observations obtained with the Chandra X-ray Observatory (Chandra) and XMM-Newton.
Methods. We analyzed X-ray spectra, light curves, and images of ESO 338-4 to constrain the nature of its X-ray sources. Additionally, we employed photoionization modeling to assess the significance of X-ray sources to the observed nebular He IIλ4686 Å emission.
Results. We identified five ultraluminous X-ray sources (ULXs) and diffuse hot gas surrounding ESO 338-4. Two of the ULXs are spatially associated with stellar clusters. The total galactic X-ray luminosity exceeds 1041 erg s−1. The brightest point source, ULX1, is variable on timescales of days and is not associated with a stellar cluster. Last, our modeling demonstrates that X-ray sources significantly affect the ionizing photon budget of the galaxy. Photoionization modeling with ULX1 as the ionizing source predicts a high nebular He IIλ4686 Å line luminosity of approximately 1039 erg s−1.
Key words: galaxies: dwarf / galaxies: halos / galaxies: individual: ESO 338-4 / X-rays: binaries
Based on observations obtained with the science missions Chandra and XMM-Newton.
© The Authors 2026
 Open Access article, published by EDP Sciences, under the terms of the Creative Commons Attribution License (https://creativecommons.org/licenses/by/4.0), which permits unrestricted use, distribution, and reproduction in any medium, provided the original work is properly cited.
This article is published in open access under the Subscribe to Open model. This email address is being protected from spambots. You need JavaScript enabled to view it. to support open access publication.
1. Introduction
X-ray observations of metal-poor (low-Z) dwarf starburst galaxies are essential for understanding stellar feedback. Their X-ray emission traces the energetic feedback from massive stars and supernovae that drives metal-enriched outflows into the circumgalactic medium. In contrast to the extensively studied hot halos of massive galaxies (Bogdán & Vogelsberger 2024), however, the X-ray properties of dwarf starburst halos remain poorly understood. Only a few detections have been reported to date (Ott et al. 2005; Hayes et al. 2007), and many low-mass galaxies lack any detectable X-ray emission from their gaseous halos (He et al. 2025).
The brightest X-ray point sources in young starbursts are high-mass X-ray binaries (HMXBs), which host a neutron star or black hole and accrete matter from massive donor stars through either stellar winds or Roche-lobe overflow. The integrated X-ray luminosity from HMXBs scales with a galaxy’s recent star formation rate (SFR; Grimm et al. 2003; Mineo et al. 2012). The SFR-scaled X-ray luminosity function (XLF) also depends on the gas-phase metallicity, producing a scaling relation between LX/SFR and 12 + log(O/H), with an observed inverse correlation (Lehmer et al. 2022, 2024). However, the metallicities of most observed galaxies are close to solar, highlighting the importance of careful studies of starbursts at the lowest metallicities.
An unresolved problem in studies of low-Z galaxies is accounting for the total nebular He IIλ4686 Å emission; this is a central aspect of the so-called He II problem. Models of the galactic ionizing photon budget that only include stellar populations often underpredict the observed He II luminosities (e.g., Stasińska et al. 2015; Stanway & Eldridge 2019; Saxena et al. 2020a; Berg et al. 2021). The role of X-ray binaries in the ionizing photon budget remains debated: while several studies found their contribution insufficient to explain the observed He II luminosities (e.g., Saxena et al. 2020b; Senchyna et al. 2020; Katz et al. 2023; Lecroq et al. 2024), others demonstrated that they can supply a substantial fraction of the required ionizing photons (e.g., Simmonds et al. 2021; Lehmer et al. 2022; Oskinova & Schaerer 2022; Umeda et al. 2022; Garofali et al. 2024; Kouroumpatzakis & Svoboda 2025).
One of the best systems for studying the properties of low-metallicity starbursts is the blue compact dwarf galaxy (BCG) ESO 338-4. Located at a distance of 40 Mpc (HyperLEDA database, Makarov et al. 2014), the galaxy has been extensively studied in the optical and UV with the Hubble Space Telescope (HST; Östlin et al. 1998, 2003) and with the Multi Unit Spectroscopic Explorer (MUSE) instrument at the Very Large Telescope (VLT), as presented by the comprehensive review of Bik et al. (2018).
Östlin et al. (1998, 2001, 2003) investigated the age and masses of 124 star clusters identified in HST UV and optical images, deriving that the current starburst has been active during the last 40 Myr, and showing evidence for propagating star formation and structures triggered by galactic winds. The SFR derived from their HST Hα-integrated luminosity was 3.2 M⊙ yr−1 (corresponding to 3.6 M⊙ yr−1 at the distance of 40 Mpc). This was later updated to 3.9 M⊙ yr−1 (4.4 M⊙ yr−1 at 40 Mpc) in Östlin et al. (2009). This value is higher than the SFR of 1.9 M⊙ yr−1 (2.2 M⊙ yr−1 at 40 Mpc) reported by Bik et al. (2018) from their Hα observations with MUSE. This discrepancy arises from the lower Hα luminosity measured with MUSE and the different electronic densities assumed in the conversion to ionizing photons flux and also from differences in the adopted conversion factors: Östlin et al. (2001) used their own calibration with a Salpeter (1955) initial mass function (IMF), whereas Bik et al. (2018) followed the Kennicutt & Evans (2012) prescription assuming a Kroupa & Weidner (2003) IMF. Lehmer et al. (2024), in contrast, modeled the galaxy’s integrated spectral energy distribution from the far-UV to the far-IR and inferred an SFR of 0.6 M⊙ yr−1 averaged over the last 125 Myr.
The spread in reported SFR values reflects methodological differences and the distinct timescales probed by the various indicators, and it thus represents the inherent method-dependent variance in SFR estimates for ESO 338-4. We assume the mean value of the SFRs derived from Hα luminosities, SFR = 3.3 M⊙ yr−1, when referring to short-term phenomena such as the diffuse soft X-ray emission, and the 125 Myr averaged value, SFR125 Myr = 0.6 M⊙ yr−1, when comparing with the population of HMXBs and their associated luminosity.
The galaxy hosts over 50 stellar clusters younger than a few million years, with masses exceeding 105 M⊙. At its metallicity of 12 + log(O/H)≈7.9 (12% solar; Bergvall 1985), no other nearby galaxy contains such a large number of massive clusters. Similar cluster populations are found only in metal-rich mergers (e.g., the Antennae) or more distant galaxies (e.g., Haro 11). Some clusters exhibit prominent Wolf-Rayet (WR) spectral features. The brightest among the WR clusters and in the galaxy overall is Cluster 23 (CL23). This is one of the most massive known young clusters with M > 107 M⊙ and an age of 4 Myr (Östlin et al. 2007). It is surrounded by an open superbubble detected in Hα and has been associated with a large-scale outflow that injects material into the circumgalactic medium. Furthermore, ESO 338-4 is a candidate Lyman-continuum (LyC) galaxy (Leitet et al. 2013). Its total He IIλ4686 Å line luminosity has been reported as  (Oskinova et al. 2019). The average He II λ4686 Å/Hβ ratio, as calculated in an aperture with a radius of 4″ from CL23, is 0.019 ± 0.001. The galaxy is confidently within the star-forming region of BPT diagrams as presented by Bik et al. (2018). In X-rays, three ultraluminous X-ray sources (ULX) and bright diffuse plasma emission surrounding the galaxy were initially detected by Oskinova et al. (2019).
Deep X-ray observations of nearby low-metallicity starbursts are essential for constraining their X-ray binary populations and to search for diffuse hot gas, both of which trace stellar feedback and its effect on the surrounding medium. We analyze new deep Chandra and XMM-Newton observations of ESO 338-4. This paper is organized as follows. In Sect. 2 we describe our observations, the data reduction, and the spectral analysis. Section 3 presents our results and discusses them in the context of current X-ray luminosity functions, gaseous halos in dwarf starbursts, and the connection between HMXBs and nebular emission. Section 4 summarizes our conclusions. Unless otherwise stated, all X-ray luminosities are reported in the 0.5–8 keV band.
2. X-ray observations and data analysis
2.1. Chandra
In 2023, ESO 338-4 was observed 16 times by Chandra (PI: L. Oskinova; proposal 23620207; see the appendix A for the observation log) with the ACIS-I array for a combined exposure of 295.35 ks. The data were reprocessed by applying the latest calibrations with version 4.16 of the Chandra Interactive Analysis of Observations (CIAO)1 data analysis software. Taking advantage of these deep exposures, we astrometrically aligned the individual exposures with one another and subsequently aligned them with the Gaia EDR3 catalog (Gaia Collaboration 2016; Lindegren et al. 2021; Babusiaux et al. 2023; Gaia Collaboration 2023) using the CIAO analysis tools wcs_match and wcs_update.
The final merged and exposure-corrected Chandra image of ESO 338-4 in the 0.5 − 7 keV range is presented in Fig. 1. To identify X-ray emitters within the galaxy, we used the CIAO source detection algorithm wavdetect. This tool accounts for the instrument point spread function (PSF) and allows the disentanglement of point sources in close proximity (Freeman et al. 2002). The resulting count distribution boundaries at a 3σ level of each source and its location are indicated in Fig. 1. We computed the limiting sensitivity using the CIAO lim_sens function, which returns results in units of photons cm−2 s−1. To convert this into a flux, we assumed an energy-independent photon spectrum over the 0.5–7 keV band. At the distance of ESO 338-4 (D = 40 Mpc), this corresponds to a luminosity of  . This value represents the flux significance threshold (≈3σ) and is therefore somewhat higher than the formal source detection limit. From east to west, we labeled the four sources detected by wavdetect as ULX 1–4. As discussed in Sect. 2.4, all sources are above the ULX luminosity classification limit of LX > 1039 erg s−1 (Kaaret et al. 2017; King et al. 2023, and references therein), which corresponds to the critical Eddington luminosity of a 10 M⊙ black hole. Therefore, for consistency reasons, we refer to them throughout this manuscript as ULXs.
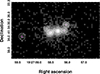 |
Fig. 1. Merged intensity image of the 16 Chandra observations analyzed in this work (the log of the observations is summarized in Appendix A). The observations were taken with the ACIS-I array, and the image is exposure corrected. We highlight the boundaries of the count distribution of each source at a 3σ level through white ellipses. The magenta ellipses present the source locations along with their 1σ uncertainty in position. ULX1-4 and X6 were detected by wavdetect, while ULX5 was manually added as described in the text. |
In addition to the four point sources detected by wavdetect, we manually identified a fifth source in the easternmost part of the galaxy. This detection was motivated by (a) visual inspection of the image and (b) an examination of a diffuse image map of the galaxy. For the latter, we followed standard procedures within CIAO. Thus, we removed the point source contribution from the images and replaced the missing pixel values with interpolated values from the local (diffuse) background. This revealed a bright locus around the proposed location of ULX5.
Furthermore, wavdetect reported a faint sixth source within the areal extent of the galaxy, offset farther to the east. We labeled it X6, as its luminosity is below the ULX threshold. With only ≈20 counts detected in the merged data set, all below 3 keV, no spectral or temporal analysis is feasible. We characterize it as a soft source, and its marginal contribution to the overall count rate was removed whenever relevant. We do not discuss this source further. The positions of all six sources are listed in Table 1.
Locations of X-ray point sources in ESO 338-4.
Three of the wavdetect ULXs (ULX1–3) were previously reported by Oskinova et al. (2019), while our much deeper Chandra exposures (295.35 ks vs. 3.05 ks) enable the detection of an additional wavdetect ULX (ULX4) and faint X-ray source (X6), and of the manually identified ULX5.
2.2. XMM-Newton
In addition to our Chandra observations, we took advantage of XMM-Newton data using the higher sensitivity of the latter at energies below 1 keV to study the soft X-ray range of the sources and the diffuse emission of the galactic halo. In addition to the 2016 data presented by Oskinova et al. (2019), XMM-Newton observed ESO 338-4 on 17 October 2021 (PI: L. Oskinova; ObsID 0892410101; see Appendix A for the observation log). We used version 21.0.0 of the Science Analysis System (SAS)2 to reprocess and filter our data for good-time intervals (GTI). After we rejected periods of elevated background, the final useful exposures are 59.58 ks for the EPIC pn and 144.48 ks for the two combined EPIC MOS cameras.
Following standard data analysis steps, we background-corrected and combined the exposures from the EPIC-pn and the two EPIC-MOS cameras in the 0.4–12 keV range. The resulting adaptively smoothed image is presented in Fig. 2.
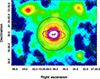 |
Fig. 2. Intensity image of the combined XMM-Newton EPIC pn and MOS1/2 exposures in the 0.2–12 keV band. The image has been adaptively smoothed and background corrected following standard SAS procedures and is presented with the gist_ncar color map. We highlight the Chandra 3σ contours presented in Fig. 1 with black ellipses. Since XMM-Newton does not resolve the individual sources, we depict them through a blended central region represented by the larger black ellipse. To highlight the different scale between the Chandra and XMM-Newton images, we note the extent of Fig. 1 with a white box. For purposes of the spectral fitting in Sect. 2.4, we describe the galactic halo as the region between the black ellipse and the magenta circle. Beyond the halo, soft diffuse structures are visible, extending significantly beyond the extent of the galaxy. A second extended halo is defined by the region between the magenta and blue circles. Its properties agree with the galactic halo and are discussed in Appendix B. The D25 ellipse (HyperLEDA; Makarov et al. 2014) is noted with dashed black to facilitate comparison with the optical extent of the galaxy. The two bright loci in the NW and NE of the galaxy are background sources not associated with ESO 338-4. |
The lower angular resolution of the XMM-Newton PSF half-energy width (HEW of 15″ and 14″ for EPIC pn and MOS, respectively) compared to Chandra (0.6″) blends the five ULX detected by Chandra into an unresolved central region. This central region (Fig. 2) was therefore defined to include all five Chandra-resolved ULXs within an aperture that exceeded the XMM-Newton PSF full width at half maximum of each EPIC camera and is comparable to their respective HEWs.
The sensitivity of XMM-Newton allowed us to detect soft extended X-ray emission surrounding ESO 338-4 (Fig. 2). This hot diffuse gas is referred to as the “galactic halo” throughout this paper. For the spectral analysis, the halo spectra were extracted from the brightest innermost region between the extent of the galaxy and the boundary presented in Fig. 2. We also define a second extended halo, which extends to larger radii. Its spectral properties are consistent with those of the galactic halo and are discussed in Appendix B.
2.3. Timing analysis
Our 16 Chandra observations were taken throughout approximately 200 days in 2023 (Appendix A). This allowed us to search for time variability in individual sources. We contrasted the total count rate between observations of each source in the 0.5–7 keV band. The X-ray light curves of ULX2–5 (Appendix C) show no signs of strong variability. A robust z-score analysis of all observations revealed that ULX3 and ULX4 exhibit no data points deviating beyond 3σ, while ULX2 and ULX5 each show only a single > 3σ outlier. In contrast, ULX1 is variable and displays changes exceeding 1 dex in amplitude (Fig. 3). Despite this large variation in brightness, its hardness ratio, defined as HR = (3–7 keV)/(0.5–7 keV), stayed approximately constant during the same time intervals. ULX1 dominates the X-ray point source emission in ESO 338-4 during its bright phases and remains the most luminous source when considering count rates averaged over all exposures.
 |
Fig. 3. Upper panel: Light curve of ULX1 from the 16 Chandra observations obtained in 2023. The curve was constructed from the total count rate in the 0.5–7 keV range. Lower panel: Hardness ratio of each Chandra observation between the 0.5–3 keV and the 3–7 keV range. |
We searched for short-term variability and pulsations using XMM-Newton observations. Lomb–Scargle periodograms were computed from the light curves of the three EPIC cameras in the full band and in several soft- and hard-energy bands, but no statistically significant variability was found. This indicates that no strong pulsations of ULX1 at a timescale greater than the time resolution of the EPIC cameras in full-frame mode are present (73.4 ms for the pn, and 2.6 s for the MOS cameras). However, as the XMM-Newton observations are not contemporaneous with our Chandra data and the point sources are not resolved by XMM-Newton, no conclusive argument can be made about the state of ULX1 during them. If ULX1 were to be in a low state, pulsations would therefore not be detected, as the other point sources in the unresolved region would dominate the observed X-ray emission. Thus, we cannot rule out the possibility that ULX1 is an X-ray pulsar.
2.4. Spectral analysis
The next step was to conduct a spectral analysis of the five point sources and the diffuse emission of the galaxy and its halo with the X-ray spectral fitting software XSPEC (Arnaud 1996). The Chandra data were fit in the 0.5–7 keV range, and the XMM-Newton observations were fit in the 0.2–10 keV range. We summarize the final best-fit parameters of our analysis in Table 2 and their fit statistic and goodness of fit in Table 3, and we report the X-ray luminosities of each source in Table 4. The unfolded XMM-Newton spectra for the best-fit models in the central and halo region are presented in Figs. 4 and 5, respectively.
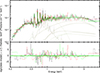 |
Fig. 4. Upper panel: XMM-Newton EPIC pn, MOS1, and MOS2 spectra of ESO 338-4 (black, red, and green curves, respectively) with 3σ errors. The best-fit model (described in Sect. 2.4.2) of the galaxy is shown with solid lines. The individual best-fit model components are shown with dashed lines. The model parameters are given in Table 2. Lower panel: Residuals between the data and the best-fit model. |
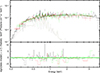 |
Fig. 5. Same as Fig. 4 for the galactic halo of ESO 338-4 defined in Fig. 2. The best-fit model is described in Sect. 2.4.2, and the model parameters are given in Table 2. |
Spectral model parameters for the five point sources and the diffuse emission in ESO 338-4.
Goodness-of-fit statistics for the spectral models fit to the Chandra and the XMM-Newton observations of ESO 338-4.
2.4.1. Spectral analysis. Chandra
During the spectral analysis, we devoted special attention to the background treatment. First, a source-free region on the same CCD as the target galaxy was identified. The instrumental background extracted from this region was subtracted from all spectra. Next, we addressed the local background of each point source, treating it as a local diffuse emission filling the galaxy. These regions were defined as annuli around each source region with inner and outer radii of 0.5 and 2.5 pixels3 from the source region boundary, where contributions from neighboring point sources were excluded.
Using CIAO, we separately coadded the 16 source spectra and local background spectra for each ULX. Following our timing analysis (Sect. 2.3), we analyzed an average state of ULX1.
So far, there are no universally accepted physically motivated spectral models of ULXs. The complexity of models ranges from simple power laws to sophisticated combined models requiring multiwavelength data. Furthermore, the assumptions on spectral shape at energies below those observed by the X-ray telescopes (i.e., at energies lower than 0.2 keV) crucially affect the estimates on the number of He II ionizing photons. In our spectral modeling, we considered the following three spectral models (their XSPEC names are given in parentheses): a simple power law (powerlaw), two standard multicolored black-body disks (diskbb + diskbb), and multicolor blackbody disks with a variable power-law dependence for the disk temperature, T(r) (diskpbb). For the local background emission, we considered collisionally ionized plasma (APEC), where we set the metallicity to 0.12 Z⊙ for ESO 338-4 (Bergvall 1985). Last, we considered absorption components (tbabs) for the Galactic foreground (NH = 5 × 1020 cm−2; Hayes et al. 2005), and a freely varying internal absorption within the galaxy.
We simultaneously modeled the point sources and their local background in the Chandra observations, grouping the data to a minimum of five counts per bin, and using C-statistics (Cash 1979). The Chandra spectra are presented in Appendix D. All spectral models of the local background feature a hot plasma emission with a temperature of 2–3 keV. We found that the diskpbb model provides the best fit for ULX2, the second brightest point source in ESO 338-4. Although some parameters are poorly constrained because the Chandra’ sensitivity is limited below 1 keV, the other models provided a worse fit. For ULX3–5, insufficient counts prevent a characterization of the spectral shape, and we therefore adopted the simple absorbed power-law model. All three spectral models featured equally agreeable goodness-of-fit statistics to ULX1. However, similar to ULX2, the best-fit parameters are poorly constrained. Furthermore, the hardness ratio of the 0.5–3 keV and the 3–7 keV range (Fig. 3) is not correlated with the count-rate variability in a way that would favor any specific model interpretation. Thus, to choose a model for ULX1, we used the XMM-Newton data (Sect. 2.4.2) as they provide spectral information in soft X-rays. We assumed that ULX1 dominates the count rate among point sources in the extraction region, allowing us to model its spectrum using these data.
2.4.2. Spectral analysis. XMM-Newton
To analyze the diffuse emission in the galactic halo, we adopted a two-component plasma model (APEC + APEC). This choice was motivated by the presence of hard- and soft-plasma components within the galaxy. The hard component is detected as faint local background in the Chandra observations, but is unresolved in the XMM-Newton data. The soft component is revealed by XMM-Newton because its sensitivity is higher below 1 keV than that of Chandra. For both components, the host galaxy metallicity of Z = 0.12 Z⊙ was used. The final best-fit model for the halo is tbabsGal × (APEC1 + APEC2), and the corresponding unfolded spectrum from XMM-Newton is shown in Fig. 5.
The limited angular resolution of XMM-Newton prevents the spatial separation of point sources from the surrounding diffuse emission in ESO 338-4. Consequently, we fit the blended central region of our XMM-Newton 2021 observations (Fig. 2) with the combination of the individual ULX models and an APEC component to account for unresolved hot gas within the galaxy that is not detectable with Chandra. We refrained from adding a second APEC component, as in the halo analysis, because the corresponding hard thermal contribution is negligible with respect to the dominant ULX emission (Appendix D) and would therefore not yield well-constrained parameters.
We used the Cash statistics and a minimum of 15 counts per bin. We note that because the GTI of the 2021 observations was longer than those of 2016, we focused our analysis solely on the former. However, all subsequent results were confirmed by simultaneously fitting the 2016 data along with the 2021 data. During the fitting procedure, we froze the parameters of ULX2–54 and the constrained parameters of ULX1. All three spectral models for ULX1 (powerlaw, diskpbb, and diskbb + diskbb) feature comparable fit statistics and are well constrained. However, of these, only the diskbb + diskbb model yields a hot gas temperature for the APEC component that is consistent with the soft thermal emission detected in the halo. We therefore adopted diskbb + diskbb as the preferred spectral model for ULX1. The final best-fit model for the central region was tbabsGal × (tbabsULX1 × (diskbb1 + diskbb1) + tbabsULX2 × diskpbb + tbabsULX3 × powerlaw1 + tbabsULX4 × powerlaw2 + tbabsULX5 × powerlaw3 + APEC), and the corresponding unfolded spectrum from XMM-Newton is shown in Fig. 4.
It is common for halo gas to exhibit lower metallicities than the galaxy ISM (Tumlinson et al. 2017). To assess the feasibility of such a scenario, we explored models with metallicities in the range Z = 0.02 − 0.12 Z⊙. This analysis confirmed that our adopted model provides the most robust description of the data, while lower-metallicity models yield either unconstrained parameters or unphysical solutions.
As discussed in Sect. 2.3, the offsets in observational times and the differences between the angular resolutions of Chandra and XMM-Newton limit the reliability of using one dataset to inform the analysis of the time-variable ULX1 in the other. However, when we freely varied all spectral model parameters of ULX1 in the XMM-Newton fit, a hard diskbb component was returned with parameters comparable to those derived from the Chandra data. This consistency supports the interpretation that the model captures the average spectral properties of the source.
The spectral models described above allowed us to predict the luminosity between the ionization potential of He II of 54 eV (4 Ry) and the upper range of XMM-Newton, 12 keV (Table 4). We found that the total 0.054–12 keV luminosity for ESO 338-4 is  [erg s−1]) = 41.6, with ULX1 contributing
  [erg s−1]) = 41.5 (80%; the contribution of ULX1 to the total absorption-corrected X-ray luminosity of the galaxy is 65%). We do not report values for ULX3, 4, or 5, as their model description of a power law would yield unrealistically high luminosities at UV energies. For this reason, these point sources were also not corrected for intrinsic absorption in the derivation of the galaxy luminosity.
Luminosities of ULX and diffuse emission in ESO 338-4.
2.4.3. The E > 1 keV halo component
An important caveat concerns the origin of the hotter (kT ≃ 3.5 keV) plasma component. One possible explanation is that it reflects the broad XMM-Newton PSF wings, which would allow counts from the central region to contribute to the halo spectrum. While this possibility cannot be excluded without a dedicated PSF simulation, which is beyond the scope of this paper, our data suggest that the component is not entirely instrumental.
We fit the XMM-Newton halo region with two alternative models: tbabsGal × (APEC1 + APEC2) and tbabsGal × (APEC + const × (point-source contribution)). The parameters and fit statistic of the former are presented in Tables 2 and 3. The latter represents soft-plasma emission with contamination from the ULX population, with parameters fixed according to Table 2. This fit yields APEC parameters of kT = (0.244 ± 0.008) keV, Norm = (7.2 ± 0.3)×10−6, and a constant factor of 0.170 ± 0.005; a PSF fraction of roughly 20%. Its C-statistic for this fit is 247 for 214 d.o.f. and pnull = 0.062. Both models provided comparable fit statistics, indicating that the data do not allow us to distinguish uniquely between unresolved point-source contamination and a hot diffuse plasma.
Additional support for a noninstrumental contribution comes from the coadded spectrum of the 16 Chandra observations extracted from the halo region (Fig. 6). Although the Chandra PSF is much narrower, the coadded spectrum shows a weak but persistent excess relative to the local background in the 2–6 keV range; the best-fit hot APEC temperature from the XMM-Newton fit (kT ≃ 3.5 keV) lies inside this energy interval, where the Chandra halo spectrum and background begin to diverge. The excess is marginal and might be affected by statistical fluctuations, but its persistence in the coadded Chandra data means that it probably is not purely noise. We therefore included the hot component in our modeling, but regard it as tentative until deeper data or future PSF simulations can clarify its origin.
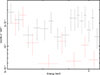 |
Fig. 6. Coadded spectrum of the halo region (black) compared to the corresponding local background (red), extracted from the 16 Chandra observations. A weak but systematic excess is visible in the 2–6 keV band, consistent with the hotter (kT ≃ 3.5 keV) component inferred from the XMM-Newton analysis (Table 2). The spectrum is shown without background subtraction to illustrate the level of the excess relative to the local background. |
Previous halo studies have mainly targeted spiral or elliptical galaxies, often limited to soft-band analyses or modeling harder emission as unresolved sources, typically with shorter exposures (Strickland et al. 2004a,b; Boroson et al. 2011; Li & Wang 2013). In these circumstances, a faint extended hard component would be difficult to detect. The absence of similar reports should therefore be understood as reflecting methodological and sample differences and not as evidence against a tentative hot component in low-metallicity dwarf starbursts.
3. Results and discussion
3.1. Time variability of ULX1
The long-term variability of ULXs is an open topic and is subject to debate. We tested whether pure changes in the internal absorption column density of the spectral model of ULX1 (Table 2; parameters derived in Sect. 2.4) can explain the observed variability of ULX1. To reproduce a 1 dex change in brightness, the internal absorption would have to increase from zero to tbabsint = 3 × 1022 cm−2. This would result in a shift from HR ≈ 0.09 to HR ≈ 2.4, in contrast to the minimal changes observed in the hardness ratio of ULX1 (Fig. 3). When we assume a nonzero initial internal absorption, consistent with the local H I column density inferred from Lyα measurements, even larger changes in the column density would be required. This would produce correspondingly stronger variations in the hardness ratio, which are not observed. Therefore, we rule out variable internal absorption as the cause of the flux variability in ULX1.
3.2. HMXB X-ray luminosity in low-Z galaxies
Recent studies indicated that the X-ray luminosity of low-metallicity galaxies might be substantially higher than previously estimated (e.g., Fornasini et al. 2020; Lehmer et al. 2022; Kyritsis et al. 2025). Lehmer et al. (2024) presented a scaling relation between the integrated X-ray luminosity of high-mass X-ray binaries of galaxies and their SFR and Z, defining the LX/SFR − Z plane. By applying absorbed broken power laws to point sources observed with Chandra, they reconstructed the XLFs of individual galaxies based on their SFR and Z. ESO 338-4 was included in this sample, but with a somewhat higher metallicity of 12 + log(O/H) = 7.99 and a reported luminosity of log(LX [erg s−1]) = 40.3 ± 0.2.
In our analysis of ESO 338-4, we measured a cumulative X-ray luminosity from point sources of log(LX [erg s−1]) = 41.29 from our best-fit model of the XMM-Newton data. For comparison, Lehmer et al. (2024) reported a luminosity without correction for intrinsic absorption. When we only applied the Galactic foreground absorption correction to our spectral model, we found log(LX [erg s−1]) = 40.84. The X-ray scaling relations of Lehmer et al. (2024) were calibrated using the average SFRs over the past 100 − 125 Myr, as derived from SED-based star formation histories. To enable a direct comparison with their best-fit LX/SFR − Z relation, we therefore adopted their inferred value of SFR125 Myr = 0.6 M⊙ yr−1 for ESO 338-4. We report log(LX/SFR [erg s−1(M⊙ yr−1)−1]) ratios of 41.5 and 41.1, respectively.
We derived LX/SFR values that lie slightly above the average relation of the fundamental LX/SFR − Z plane presented in Lehmer et al. (2024), but within their 3σ confidence interval. Based on the scaling relation of King et al. (2023), a galaxy with an SFR equal to the mean SFR of ESO 338-4 in this study (2 M⊙ yr−1) would be expected to host roughly one bright ULX. In contrast, ESO 338-4 contains four sources with log(LXcor [erg s−1]) > 40, including one that exceeds log(LXcor [erg s−1]) > 41. Nevertheless, this mild excess in luminous sources is consistent with Poisson fluctuations, which are common at the high-LX end of X-ray luminosity functions. Therefore, ESO 338-4 does not appear to be an outlier relative to XLF predictions based on metallicity and star formation history.
To estimate the contribution from the cosmic X-ray background (CXB), we used the results presented in Kim et al. (2007). They analyzed combined data from the Chandra Multiwavelength Project and the Chandra Deep Field-South surveys, reporting CXB flux densities in units of erg s−1 cm−2 deg−2. Multiplying these values by the projected area of ESO 338-4 (indicated by the black ellipse in Fig. 2) and its distance, we found that the CXB luminosity is lower than 1% of the observed X-ray luminosity, indicating that background corrections do not play a significant role in luminosity derivations.
3.3. The galactic halo of ESO 338-4
Optical observations reveal that ESO 338-4 drives galactic outflows, traced by Hα velocity measurements. In particular, a prominent outflow cone has been linked to CL23, a bright stellar cluster located at the base of the structure and surrounded by an open superbubble (Bik et al. 2018). These outflows suggest significant feedback activity capable of shaping the circumgalactic medium.
Our new deep XMM-Newton observations allowed us to map the distribution of hot gas and compare it to the morphology seen in the optical. In Fig. 7 we present the Hα velocity field from Bik et al. (2018) overlaid with X-ray count-rate contours derived from the combined exposures shown in Fig. 2. This comparison highlights the spatial distribution of the diffuse X-ray emission relative to the optical galaxy morphology. The X-ray contours reveal an elongated structure extending northward, spatially coincident with the direction of the optical outflow. This soft X-ray feature might be linked to the galaxy-wide feedback processes, and it might potentially be linked to the activity of CL23 and its associated superbubble. However, the superbubble itself remains undetected in X-rays by Chandra, likely because it is too faint to be distinguished from the surrounding bright ULXs.
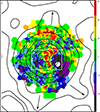 |
Fig. 7. Hα velocity map of ESO 338-4 presented in Bik et al. (2018). The color map indicates the blue- and redshifted regions from −30 to 30 km s−1. CL23 is located at the center of the image, at the base of the positive velocity structure. The image is oriented with north up and east to the left. We note the logarithmically scaled XMM-Newton count contours derived from the combined data set of Fig. 2 in black. The black arrows indicate three elongated soft X-ray features. One of them coincides with the direction of the northern outflow cone. With a white box, we indicate the extent of Fig. 1, highlighting the difference in scale between the diffuse X-ray emission in the halo and the extent of the galaxy. |
3.3.1. Hot-gas mass
Based on the spectral fits presented in Sect. 2.4, we estimated the mass of the hot gas in ESO 338-4. This was done using the emission measures (EM) of the diffuse halo emission components, defined as EM = ∫nenHdV, where ne and nH are the electron and hydrogen densities, respectively, and dV is the volume element. In the APEC model, the thermal plasma normalization relates to the emission measure via  , assuming negligible redshift and a distance D to the galaxy. Plasma models in XSPEC assume a fully ionized gas with a fixed ratio of ne/nH = 1.2. This ratio is accurate to within 3.5% for solar abundance plasmas at temperatures between 0.10 and 40 keV (Leahy et al. 2024). Given the low metallicity of ESO 338-4 and the fact that deviations from this ratio are smaller than the uncertainties on the normalization of the APEC component, the assumed ratio of 1.2 remains an appropriate approximation.
Potential metal enrichment in the halo might imply different best-fit parameters of the plasma models. To test for deviations from the previously assumed metallicity of Z = 0.12 Z⊙, we repeated the spectral fitting using two VAPEC components in place of the two APEC models. The best-fit scenario returned an enrichment of oxygen and neon of ZO = (0.2 ± 0.1) Z⊙ and ZNe = (1.0 ± 0.4) Z⊙, with the other element abundances fixed at 0.12 Z⊙. The resulting plasma temperatures and normalizations are consistent within the uncertainties with those obtained using the original APEC models. For consistency and simplicity, we therefore proceeded with the parameters listed in Table 2 for all further calculations.
Estimating the halo hot-gas mass requires assumptions about the density profile and the geometry of the emitting volume. For the former, we adopted a homogeneous distribution of matter, while for the latter, we assumed a sphere. The optical extent of the galaxy (Fig. 2) was excluded from this volume and was modeled separately as a cylinder with a height equal to the sphere radius. We derived  for the 0.26 keV (T1 = 3.0 MK) and
  for the 3.5 keV (T2 = 4 MK) component. Performing the same calculation for the diffuse component of the cylindrical central region yielded
  . Thus, based on XMM-Newton observations, we estimate the total hot gas mass in ESO 338-4 to be
  , with the halo alone contributing
  .
.
Our hot-gas mass estimate is a few times higher than that derived from optical data. Bik et al. (2018) reported the Hα emitting gas mass as MH II = 3.0 × 10⁷ M⊙ using a modeled density profile for the galaxy. In contrast, an earlier warm-gas mass estimate assuming a constant density yielded MH II = 16 × 107 M⊙ (Östlin et al. 1999). These comparisons suggest that the hot and warm ionized gas masses in ESO 338-4 are broadly similar. All ionized mass estimates are significantly lower than the neutral hydrogen mass of MH I = (1.4 ± 0.2) × 109 M⊙ suggested by Cannon et al. (2004) using H I observations, however.
3.3.2. X-ray luminosity
The soft X-ray emission originates from the interaction of the large amounts of mechanical energy released by the starburst episode with the interstellar medium around the newly formed stars, as evidenced by the hot bubbles identified around the central clusters of ESO 338-4 in the optical images. The total release of mechanical energy from stellar winds and supernova explosions was computed in several studies following the prescriptions of Leitherer et al. (1992), including Cerviño et al. (2002), Stevens & Hartwell (2003), Oskinova (2005), and Otí-Floranes & Mas-Hesse (2010). As concluded by these authors, the soft X-ray luminosity of star-forming galaxies can be reproduced by their synthesis models assuming that the average fraction of mechanical energy that is released in the form of soft X-rays by the heated gas is in the range Xeff = 1 − 10%. Using the calibrations by Otí-Floranes & Mas-Hesse (2010), a log(LX [erg s−1]) = 40.26 originated in the diffuse medium with an SFR of 3.3 M⊙ yr−1 over more than 30 Myr, would require a realistic efficiency Xeff ≈ 0.02 (assuming an SFR computed for a Salpeter initial mass function within a mass range 0.1 − 100 M⊙). This would confirm that the observed diffuse soft X-ray emission is consistent with originating from the mechanical energy released by the massive stars after interaction with the interstellar medium.
We compared the X-ray halo luminosity of ESO 338-4 with that of other dwarf starburst galaxies. Ott et al. (2005) analyzed seven galaxies. Five of them (NGC 3077, NGC 4449, NGC 5253, NGC 4214, and He 2–10) were found to feature X-ray bright galactic halos, with two nondetections (VII Zw 403 and I Zw 18). Their analysis discussed a positive correlation between the halo luminosity and host galaxy metallicity.
Among the X-ray bright halos, NGC 1569 exhibits the lowest luminosity, LX0.3 − 8 keV = 4.2 × 1038 erg s−1, and a galaxy metallicity of 12 + log(O/H) = 8.22. The brightest halo is found in He 2–105, with LX0.3 − 8 keV = 2.0 × 1040 erg s−1 and a near-solar metallicity. A comparable halo luminosity is measured in ESO 338-4, LX0.3 − 8 keV = 1.68 × 1040 erg s−1. The galaxy, however, is a dwarf starburst with a metallicity of 12 + log(O/H) = 7.9, lower than any of the five galaxies with hot-gas detections in their sample. Interestingly, the SFR of ESO 338-4 is higher than that of any system in their sample. Therefore, we suggest that the halo LX correlates primarily with the SFR and not with Z, a relation that was also reported for spiral galaxies (Strickland et al. 2004b; Li & Wang 2013).
3.4. X-ray sources as sources of He II ionizing radiation
To quantify the importance of X-rays for the ionizing photon budget of ESO 338-4, we first needed to search for optical counterparts to the ULXs. The spatial separation between ULXs and clusters is particularly important when discussing the distinct components of the narrow and broad He IIλ4686 Å emission: while the broad component originates from WR stars, the narrow emission arises from nebulae ionized either by massive stars or X-ray sources. When WR stars and ULXs are spatially coincident, the combined contribution to the nebular ionizing flux complicates the interpretation of the narrow component. Moreover, the inherent difficulty of isolating the narrow emission adds an additional challenge to studies of nebular photoionization.
In ESO 338-4, four clusters (CL23, 18, 53, and 50/516) exhibit WR features. However, none of the detected ULXs coincides with these WR clusters. Some ULXs are, nonetheless, spatially associated with other stellar clusters. Using the cluster IDs of Östlin et al. (1998), we confirm the association between ULX2 and CL85, and we additionally identify ULX3 as coincident with CL82. This spatial distribution is illustrated in Fig. 8, which shows the ULX positions overlaid on a color-composite of archival HST data.
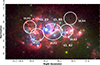 |
Fig. 8. Three-color composite HST image of ESO 338-4. Red is centered on the Hα emission line with the F656N filter, blue is in UV with the F140LP filter, and green is the F550M filter. The ULX point source positions (Table 1) along their 1σ uncertainties are overlaid on this image in black. We highlight the boundaries of the Chandra count distribution of each source at a 3σ level through white ellipses (Fig. 1). An association between ULX2 and CL85, and ULX3 and CL82 is established as their positional uncertainty is within the optical extent of the clusters. |
Recently, Kouroumpatzakis & Svoboda (2025) derived an empirical relation between the observed He IIλ4686 Å emission and the X-ray luminosity for a sample of 165 galaxies from the Chandra Source Catalogue. Our measurements are consistent with their best-fit relation for star-forming galaxies to within 1σ, suggesting that the ULX properties of ESO 338-4 do not require fine-tuning to account for the observed He IIλ4686 Å emission. The galaxy behaves consistently with the general population of He II and X-ray emitters.
To estimate the contribution of X-ray sources to the ionization budget of ESO 338-4, we used photoionization modeling of the time-averaged ULX1 emission and compared it to the observed He IIλ4686 Å emission. For this prediction, calculations were performed with version 23.01 of Cloudy (Chatzikos et al. 2023; Gunasekera et al. 2023). We assumed a spherical geometry and a hydrogen density of log(nH[cm−3]) = 2. Cloudy requires both an input SED and a luminosity defined over a specified energy interval, with the latter used to set the overall normalization. For the SED, we adopted the best-fit model of ULX1 (Table 2) corrected for Galactic and intrinsic absorption. At the range of 0.2–10 keV for the normalization, that is, the range of our XMM-Newton data, the absorption-corrected (intrinsic and Galactic) luminosity of ULX1 is log(LX [erg s−1]) = 41.4. This results in a predicted nebular He IIλ4686 Å luminosity of LHe II 4686,nebular = 1.9 × 1039 erg s−1 that is comparable to the total (narrow+broad) observed value of 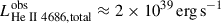 (Oskinova et al. 2019).
Our calculation did not include the stellar contribution from WR stars because our aim here was specifically to isolate the potential effect of the ULX on the excitation of He II. A detailed photoionization model incorporating the combined effects of the WR clusters and the ULX is beyond the scope of this study and will be addressed in future work. Our estimate implicitly assumed that the ULX radiation escapes isotropically and without significant attenuation by circumsource material, and it therefore represents an upper limit to the resulting nebular He II luminosity.
While the very high X-ray luminosity by ULX1 would therefore be enough to explain the observed nebular He II luminosity, the ionizing capability of the other ULXs would not be clearly enough, with the associated LHe II 4686 values a factor above approximately 5 lower than the observed one. We therefore suggest searching for very bright ULXs in star-forming galaxies with an excess of LHe II 4686 emission.
On the other hand, the X-ray luminosity of the other ULXs in ESO338-4 is similar to the integrated X-ray luminosity of the diffuse gas, which originates from gas heated by the release of mechanical energy from massive stars. While the extrapolation to the far UV of the ULX continua is not straightforward, the diffuse intrinsic X-ray emission usually peaks below 0.5 − 2 keV, providing a significant number of photons able to ionize He II, as proposed by Cerviño et al. (2002) using a Cloudy modeling similar to ours. Therefore, we conclude that in the absence of very bright ULXs, the He II emission might originate from soft X-ray photons produced by lower-luminosity ULXs and/or hot diffuse gas (Oskinova & Schaerer 2022).
4. Conclusions
We determined and presented the X-ray properties of the dwarf starburst galaxy ESO 338-4 based on new deep observations with Chandra and XMM-Newton. Within the optical extent of the galaxy, we detected five point sources, all classified as ULXs, with LX > 1039 erg s−1. The brightest, ULX1, is strongly variable on a timescale of days, with luminosity changes exceeding one order of magnitude. No coherent pulsations are detected in the central region in the XMM-Newton data. Two ULXs are found in the vicinity of massive stellar clusters, while the others (including ULX1) are not directly associated with any observed cluster at the 1σ level.
The total point source luminosity in the galaxy is log(LX [erg s−1]) = 40.8 when corrected for Galactic absorption, or log(LX [erg s−1]) = 41.3 when including corrections for the intrinsic absorption. For an SFR of 0.6 M⊙ yr−1, these values correspond to log(LX/SFR [erg s−1(M⊙ yr−1)−1]) = 41.1 and 41.5, respectively, highlighting the high X-ray output per unit SFR in ESO 338-4.
ESO 338-4 also exhibits bright diffuse X-ray emission extending far beyond the optical extent of the galaxy. This emission is well described by a two-temperature plasma model with T1 = 3.0 MK (0.26 keV) and T2 = 4 MK (3.5 keV). The X-ray emission from the diffuse gas is consistent with predictions from synthesis models, which indicate that it is produced by the release of mechanical energy from massive stars, with an efficiency of Xeff ≈ 0.05 in converting mechanical to thermal energy, which is then reemitted in this range. The total X-ray luminosity of the hot halo is LX0.3 − 8keV = 1.7 × 1040 erg s−1, and the corresponding hot-gas mass is  . Its morphology shows a northern elongation aligned with the direction of the galactic outflow traced by Hα kinematics.
Finally, we assessed the contribution of ULX1 to the galaxy’s ionizing photon budget. Using spectral modeling of the unabsorbed time-averaged ULX1 photon flux, we predict a high nebular He IIλ4686 Å luminosity of 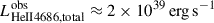 . This value is comparable with the combined broad and narrow (corresponding to stellar and nebular components, respectively) He IIλ4686 Å luminosity observed in ESO 338-4. This shows that X-rays, and ULXs in particular, can be significant contributors to the hard ionizing radiation field in low-metallicity starburst systems. The total modeled X-ray luminosity of the galaxy in the 0.054 − 12 keV band is
  [erg s−1]) = 41.6, with ULX1 alone contributing
  [erg s−1]) = 41.5.
Acknowledgments
We thank the anonymous referee for the helpful comments, which have improved the quality of this paper. The scientific results reported in this article are based to a significant degree on observations made by the Chandra X-ray Observatory. This work has made use of data from the European Space Agency (ESA) mission Gaia (https://www.cosmos.esa.int/gaia), processed by the Gaia Data Processing and Analysis Consortium (DPAC, https://www.cosmos.esa.int/web/gaia/dpac/consortium). Funding for the DPAC has been provided by national institutions, in particular the institutions participating in the Gaia Multilateral Agreement. This research has made use of the SIMBAD database, operated at CDS, Strasbourg, France, and the NASA’s Astrophysics Data System Bibliographic Services. The research presented in this paper is funded by the Deutsche Forschungsgemeinschaft (DFG, German Research Foundation) -Projektnummer 529885128. JMMH is funded by Spanish MICIU/AEI/10.13039/501100011033 and ERDF/EU grant PID2023-147338NB-C21. M.J.H. is supported by the Swedish Research Council (Vetenskapsrådet) and is Fellow of the Knut & Alice Wallenberg Foundation. Partial support for JSG’s participation in this work was provided by the National Aeronautics and Space Administration through Chandra Award Number GO2-203062X issued by the Chandra X-ray Center, which is operated by the Smithsonian Astrophysical Observatory for and on behalf of the National Aeronautics Space Administration under contract NAS8-03060. The Authors thank Angela Adamo for their feedback at the initial stages of this work.
References
- Arnaud, K. A. 1996, ASP Conf. Ser., 101, 17 [Google Scholar]
- Babusiaux, C., Fabricius, C., Khanna, S., et al. 2023, A&A, 674, A32 [NASA ADS] [CrossRef] [EDP Sciences] [Google Scholar]
- Berg, D. A., Chisholm, J., Erb, D. K., et al. 2021, ApJ, 922, 170 [CrossRef] [Google Scholar]
- Bergvall, N. 1985, A&A, 146, 269 [NASA ADS] [Google Scholar]
- Bik, A., Östlin, G., Menacho, V., et al. 2018, A&A, 619, A131 [NASA ADS] [CrossRef] [EDP Sciences] [Google Scholar]
- Bogdán, Á., & Vogelsberger, M. 2024, in X-ray Halos Around Massive Galaxies: Data and Theory, eds. C. Bambi, & A. Santangelo (Singapore: Springer Nature Singapore), 4369 [Google Scholar]
- Boroson, B., Kim, D.-W., & Fabbiano, G. 2011, ApJ, 729, 12 [NASA ADS] [CrossRef] [Google Scholar]
- Cannon, J. M., Skillman, E. D., Kunth, D., et al. 2004, ApJ, 608, 768 [NASA ADS] [CrossRef] [Google Scholar]
- Cash, W. 1979, ApJ, 228, 939 [Google Scholar]
- Cerviño, M., Mas-Hesse, J. M., & Kunth, D. 2002, A&A, 392, 19 [NASA ADS] [CrossRef] [EDP Sciences] [Google Scholar]
- Chatzikos, M., Bianchi, S., Camilloni, F., et al. 2023, Rev. Mex. Astron. Astrofis., 59, 327 [Google Scholar]
- Fornasini, F. M., Civano, F., & Suh, H. 2020, MNRAS, 495, 771 [NASA ADS] [CrossRef] [Google Scholar]
- Freeman, P. E., Kashyap, V., Rosner, R., & Lamb, D. Q. 2002, ApJS, 138, 185 [Google Scholar]
- Gaia Collaboration (Prusti, T., et al.) 2016, A&A, 595, A1 [NASA ADS] [CrossRef] [EDP Sciences] [Google Scholar]
- Gaia Collaboration (Vallenari, A., et al.) 2023, A&A, 674, A1 [NASA ADS] [CrossRef] [EDP Sciences] [Google Scholar]
- Garofali, K., Basu-Zych, A. R., Johnson, B. D., et al. 2024, ApJ, 960, 13 [NASA ADS] [CrossRef] [Google Scholar]
- Grimm, H. J., Gilfanov, M., & Sunyaev, R. 2003, MNRAS, 339, 793 [Google Scholar]
- Gunasekera, C. M., van Hoof, P. A. M., Chatzikos, M., & Ferland, G. J. 2023, Res. Notes AAS, 7, 246 [Google Scholar]
- Hayes, M., Östlin, G., Mas-Hesse, J. M., et al. 2005, A&A, 438, 71 [NASA ADS] [CrossRef] [EDP Sciences] [Google Scholar]
- Hayes, M., Östlin, G., Atek, H., et al. 2007, MNRAS, 382, 1465 [NASA ADS] [Google Scholar]
- He, L., Li, Z., Hou, M., et al. 2025, ApJ, 983, 149 [Google Scholar]
- Kaaret, P., Feng, H., & Roberts, T. P. 2017, ARA&A, 55, 303 [Google Scholar]
- Katz, H., Saxena, A., Cameron, A. J., et al. 2023, MNRAS, 518, 592 [Google Scholar]
- Kennicutt, R. C., & Evans, N. J. 2012, ARA&A, 50, 531 [NASA ADS] [CrossRef] [Google Scholar]
- Kim, M., Wilkes, B. J., Kim, D.-W., et al. 2007, ApJ, 659, 29 [NASA ADS] [CrossRef] [Google Scholar]
- King, A., Lasota, J.-P., & Middleton, M. 2023, New Astron. Rev., 96, 101672 [CrossRef] [Google Scholar]
- Kouroumpatzakis, K., & Svoboda, J. 2025, A&A, 696, A133 [NASA ADS] [CrossRef] [EDP Sciences] [Google Scholar]
- Kroupa, P., & Weidner, C. 2003, ApJ, 598, 1076 [NASA ADS] [CrossRef] [Google Scholar]
- Kyritsis, E., Zezas, A., Haberl, F., et al. 2025, A&A, 694, A128 [NASA ADS] [CrossRef] [EDP Sciences] [Google Scholar]
- Leahy, D. A., Foster, A., & Seitenzahl, I. 2024, AJ, 167, 130 [Google Scholar]
- Lecroq, M., Charlot, S., Bressan, A., et al. 2024, MNRAS, 527, 9480 [Google Scholar]
- Lehmer, B. D., Eufrasio, R. T., Basu-Zych, A., et al. 2022, ApJ, 930, 135 [NASA ADS] [CrossRef] [Google Scholar]
- Lehmer, B. D., Monson, E. B., Eufrasio, R. T., et al. 2024, ApJ, 977, 189 [NASA ADS] [CrossRef] [Google Scholar]
- Leitet, E., Bergvall, N., Hayes, M., Linné, S., & Zackrisson, E. 2013, A&A, 553, A106 [NASA ADS] [CrossRef] [EDP Sciences] [Google Scholar]
- Leitherer, C., Robert, C., & Drissen, L. 1992, ApJ, 401, 596 [Google Scholar]
- Li, J.-T., & Wang, Q. D. 2013, MNRAS, 435, 3071 [NASA ADS] [CrossRef] [Google Scholar]
- Lindegren, L., Klioner, S. A., Hernández, J., et al. 2021, A&A, 649, A2 [EDP Sciences] [Google Scholar]
- Makarov, D., Prugniel, P., Terekhova, N., Courtois, H., & Vauglin, I. 2014, A&A, 570, A13 [NASA ADS] [CrossRef] [EDP Sciences] [Google Scholar]
- Mineo, S., Gilfanov, M., & Sunyaev, R. 2012, MNRAS, 419, 2095 [Google Scholar]
- Oskinova, L. M. 2005, MNRAS, 361, 679 [NASA ADS] [CrossRef] [Google Scholar]
- Oskinova, L. M., & Schaerer, D. 2022, A&A, 661, A67 [NASA ADS] [CrossRef] [EDP Sciences] [Google Scholar]
- Oskinova, L. M., Bik, A., Mas-Hesse, J. M., et al. 2019, A&A, 627, A63 [NASA ADS] [CrossRef] [EDP Sciences] [Google Scholar]
- Östlin, G., Bergvall, N., & Roennback, J. 1998, A&A, 335, 85 [NASA ADS] [Google Scholar]
- Östlin, G., Amram, P., Masegosa, J., Bergvall, N., & Boulesteix, J. 1999, A&AS, 137, 419 [NASA ADS] [CrossRef] [EDP Sciences] [Google Scholar]
- Östlin, G., Amram, P., Bergvall, N., et al. 2001, A&A, 374, 800 [NASA ADS] [CrossRef] [EDP Sciences] [Google Scholar]
- Östlin, G., Zackrisson, E., Bergvall, N., & Rönnback, J. 2003, A&A, 408, 887 [NASA ADS] [CrossRef] [EDP Sciences] [Google Scholar]
- Östlin, G., Cumming, R. J., & Bergvall, N. 2007, A&A, 461, 471 [NASA ADS] [CrossRef] [EDP Sciences] [Google Scholar]
- Östlin, G., Hayes, M., Kunth, D., et al. 2009, AJ, 138, 923 [NASA ADS] [CrossRef] [Google Scholar]
- Otí-Floranes, H., & Mas-Hesse, J. M. 2010, A&A, 511, A61 [NASA ADS] [CrossRef] [EDP Sciences] [Google Scholar]
- Ott, J., Walter, F., & Brinks, E. 2005, MNRAS, 358, 1453 [NASA ADS] [CrossRef] [Google Scholar]
- Reines, A. E., Sivakoff, G. R., Johnson, K. E., & Brogan, C. L. 2011, Nature, 470, 66 [Google Scholar]
- Salpeter, E. E. 1955, ApJ, 121, 161 [Google Scholar]
- Saxena, A., Pentericci, L., Mirabelli, M., et al. 2020a, A&A, 636, A47 [NASA ADS] [CrossRef] [EDP Sciences] [Google Scholar]
- Saxena, A., Pentericci, L., Schaerer, D., et al. 2020b, MNRAS, 496, 3796 [Google Scholar]
- Senchyna, P., Stark, D. P., Mirocha, J., et al. 2020, MNRAS, 494, 941 [CrossRef] [Google Scholar]
- Simmonds, C., Schaerer, D., & Verhamme, A. 2021, A&A, 656, A127 [NASA ADS] [CrossRef] [EDP Sciences] [Google Scholar]
- Stanway, E. R., & Eldridge, J. J. 2019, A&A, 621, A105 [NASA ADS] [CrossRef] [EDP Sciences] [Google Scholar]
- Stasińska, G., Izotov, Y., Morisset, C., & Guseva, N. 2015, A&A, 576, A83 [NASA ADS] [CrossRef] [EDP Sciences] [Google Scholar]
- Stevens, I. R., & Hartwell, J. M. 2003, MNRAS, 339, 280 [NASA ADS] [CrossRef] [Google Scholar]
- Strickland, D. K., Heckman, T. M., Colbert, E. J. M., Hoopes, C. G., & Weaver, K. A. 2004a, ApJS, 151, 193 [Google Scholar]
- Strickland, D. K., Heckman, T. M., Colbert, E. J. M., Hoopes, C. G., & Weaver, K. A. 2004b, ApJ, 606, 829 [NASA ADS] [CrossRef] [Google Scholar]
- Tumlinson, J., Peeples, M. S., & Werk, J. K. 2017, ARA&A, 55, 389 [Google Scholar]
- Umeda, H., Ouchi, M., Nakajima, K., et al. 2022, ApJ, 930, 37 [NASA ADS] [CrossRef] [Google Scholar]
2 pixels for ULX5 to avoid including local background from ULX1 and ULX2.
Due to its lower luminosity compared to ULX1, unfreezing model parameters for ULX2 does not yield meaningful constraints.
In a later study, He 2–10 was found to host an accreting supermassive black hole (Reines et al. 2011).
Resolved initially by Östlin et al. (1998) as two separate clusters, but identified as one with a new fitting (Bik et al. 2018).
Appendix A: Log of observations
Observations of ESO 338-4 used in this paper.
Appendix B: The extended halo
Best-fit spectral parameters for the extended halo region of ESO 338-4 from the XMM-Newton data.
Appendix C: Chandra variability of ULX2–5
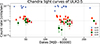 |
Fig. C.1. Light curves of ULX2–5 from the 16 Chandra observations obtained in 2023. The data points are constructed from the total count rates in the 0.5–7 keV range of each respective observation. To improve visual clarity, we applied successive +5-day offsets to the observation dates of ULX3–5, with ULX2 left unshifted. |
Appendix D: Chandra spectra
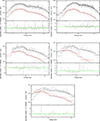 |
Fig. D.1. Chandra spectra: ULX1 (a), ULX2 (b), ULX3 (c), ULX4 (d), and ULX5 (e). Simultaneous xspec fit of the five point sources (black) and their local diffuse background (red). The C-statistic residuals of each fit are found in the bottom panel of each panel. A detailed discussion on the spectral fits and xspec models is found in Sect. 2.4 |
All Tables
Spectral model parameters for the five point sources and the diffuse emission in ESO 338-4.
Goodness-of-fit statistics for the spectral models fit to the Chandra and the XMM-Newton observations of ESO 338-4.
Best-fit spectral parameters for the extended halo region of ESO 338-4 from the XMM-Newton data.
All Figures
|
Fig. 1. Merged intensity image of the 16 Chandra observations analyzed in this work (the log of the observations is summarized in Appendix A). The observations were taken with the ACIS-I array, and the image is exposure corrected. We highlight the boundaries of the count distribution of each source at a 3σ level through white ellipses. The magenta ellipses present the source locations along with their 1σ uncertainty in position. ULX1-4 and X6 were detected by wavdetect, while ULX5 was manually added as described in the text. |
| In the text | |
|
Fig. 2. Intensity image of the combined XMM-Newton EPIC pn and MOS1/2 exposures in the 0.2–12 keV band. The image has been adaptively smoothed and background corrected following standard SAS procedures and is presented with the gist_ncar color map. We highlight the Chandra 3σ contours presented in Fig. 1 with black ellipses. Since XMM-Newton does not resolve the individual sources, we depict them through a blended central region represented by the larger black ellipse. To highlight the different scale between the Chandra and XMM-Newton images, we note the extent of Fig. 1 with a white box. For purposes of the spectral fitting in Sect. 2.4, we describe the galactic halo as the region between the black ellipse and the magenta circle. Beyond the halo, soft diffuse structures are visible, extending significantly beyond the extent of the galaxy. A second extended halo is defined by the region between the magenta and blue circles. Its properties agree with the galactic halo and are discussed in Appendix B. The D25 ellipse (HyperLEDA; Makarov et al. 2014) is noted with dashed black to facilitate comparison with the optical extent of the galaxy. The two bright loci in the NW and NE of the galaxy are background sources not associated with ESO 338-4. |
| In the text | |
|
Fig. 3. Upper panel: Light curve of ULX1 from the 16 Chandra observations obtained in 2023. The curve was constructed from the total count rate in the 0.5–7 keV range. Lower panel: Hardness ratio of each Chandra observation between the 0.5–3 keV and the 3–7 keV range. |
| In the text | |
|
Fig. 4. Upper panel: XMM-Newton EPIC pn, MOS1, and MOS2 spectra of ESO 338-4 (black, red, and green curves, respectively) with 3σ errors. The best-fit model (described in Sect. 2.4.2) of the galaxy is shown with solid lines. The individual best-fit model components are shown with dashed lines. The model parameters are given in Table 2. Lower panel: Residuals between the data and the best-fit model. |
| In the text | |
|
Fig. 5. Same as Fig. 4 for the galactic halo of ESO 338-4 defined in Fig. 2. The best-fit model is described in Sect. 2.4.2, and the model parameters are given in Table 2. |
| In the text | |
|
Fig. 6. Coadded spectrum of the halo region (black) compared to the corresponding local background (red), extracted from the 16 Chandra observations. A weak but systematic excess is visible in the 2–6 keV band, consistent with the hotter (kT ≃ 3.5 keV) component inferred from the XMM-Newton analysis (Table 2). The spectrum is shown without background subtraction to illustrate the level of the excess relative to the local background. |
| In the text | |
|
Fig. 7. Hα velocity map of ESO 338-4 presented in Bik et al. (2018). The color map indicates the blue- and redshifted regions from −30 to 30 km s−1. CL23 is located at the center of the image, at the base of the positive velocity structure. The image is oriented with north up and east to the left. We note the logarithmically scaled XMM-Newton count contours derived from the combined data set of Fig. 2 in black. The black arrows indicate three elongated soft X-ray features. One of them coincides with the direction of the northern outflow cone. With a white box, we indicate the extent of Fig. 1, highlighting the difference in scale between the diffuse X-ray emission in the halo and the extent of the galaxy. |
| In the text | |
|
Fig. 8. Three-color composite HST image of ESO 338-4. Red is centered on the Hα emission line with the F656N filter, blue is in UV with the F140LP filter, and green is the F550M filter. The ULX point source positions (Table 1) along their 1σ uncertainties are overlaid on this image in black. We highlight the boundaries of the Chandra count distribution of each source at a 3σ level through white ellipses (Fig. 1). An association between ULX2 and CL85, and ULX3 and CL82 is established as their positional uncertainty is within the optical extent of the clusters. |
| In the text | |
|
Fig. C.1. Light curves of ULX2–5 from the 16 Chandra observations obtained in 2023. The data points are constructed from the total count rates in the 0.5–7 keV range of each respective observation. To improve visual clarity, we applied successive +5-day offsets to the observation dates of ULX3–5, with ULX2 left unshifted. |
| In the text | |
|
Fig. D.1. Chandra spectra: ULX1 (a), ULX2 (b), ULX3 (c), ULX4 (d), and ULX5 (e). Simultaneous xspec fit of the five point sources (black) and their local diffuse background (red). The C-statistic residuals of each fit are found in the bottom panel of each panel. A detailed discussion on the spectral fits and xspec models is found in Sect. 2.4 |
| In the text | |
Current usage metrics show cumulative count of Article Views (full-text article views including HTML views, PDF and ePub downloads, according to the available data) and Abstracts Views on Vision4Press platform.
Data correspond to usage on the plateform after 2015. The current usage metrics is available 48-96 hours after online publication and is updated daily on week days.
Initial download of the metrics may take a while.