Open Access
Fig. 3.
Download original image
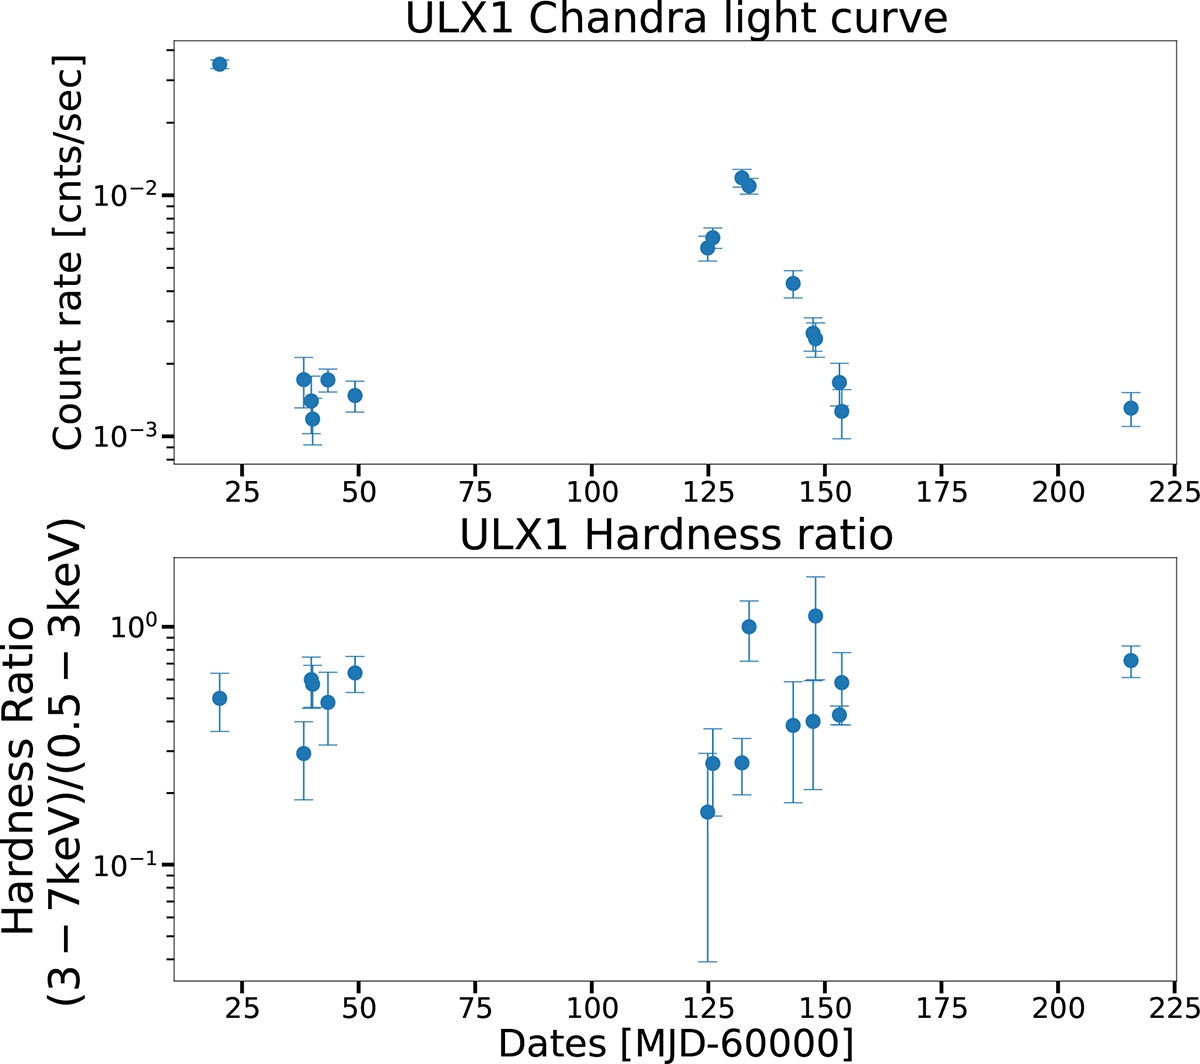
Upper panel: Light curve of ULX1 from the 16 Chandra observations obtained in 2023. The curve was constructed from the total count rate in the 0.5–7 keV range. Lower panel: Hardness ratio of each Chandra observation between the 0.5–3 keV and the 3–7 keV range.
Current usage metrics show cumulative count of Article Views (full-text article views including HTML views, PDF and ePub downloads, according to the available data) and Abstracts Views on Vision4Press platform.
Data correspond to usage on the plateform after 2015. The current usage metrics is available 48-96 hours after online publication and is updated daily on week days.
Initial download of the metrics may take a while.