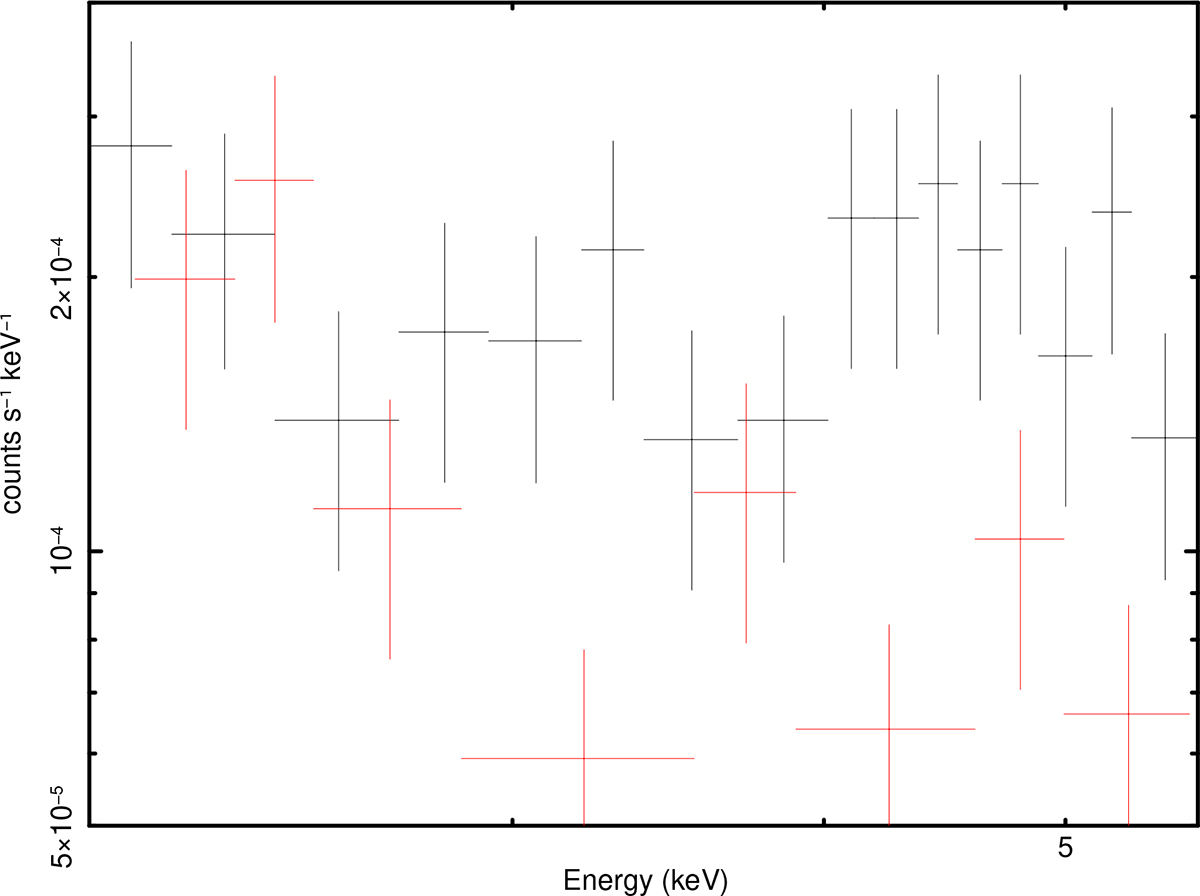
Fig. 6.
Download original image
Coadded spectrum of the halo region (black) compared to the corresponding local background (red), extracted from the 16 Chandra observations. A weak but systematic excess is visible in the 2–6 keV band, consistent with the hotter (kT ≃ 3.5 keV) component inferred from the XMM-Newton analysis (Table 2). The spectrum is shown without background subtraction to illustrate the level of the excess relative to the local background.
Current usage metrics show cumulative count of Article Views (full-text article views including HTML views, PDF and ePub downloads, according to the available data) and Abstracts Views on Vision4Press platform.
Data correspond to usage on the plateform after 2015. The current usage metrics is available 48-96 hours after online publication and is updated daily on week days.
Initial download of the metrics may take a while.