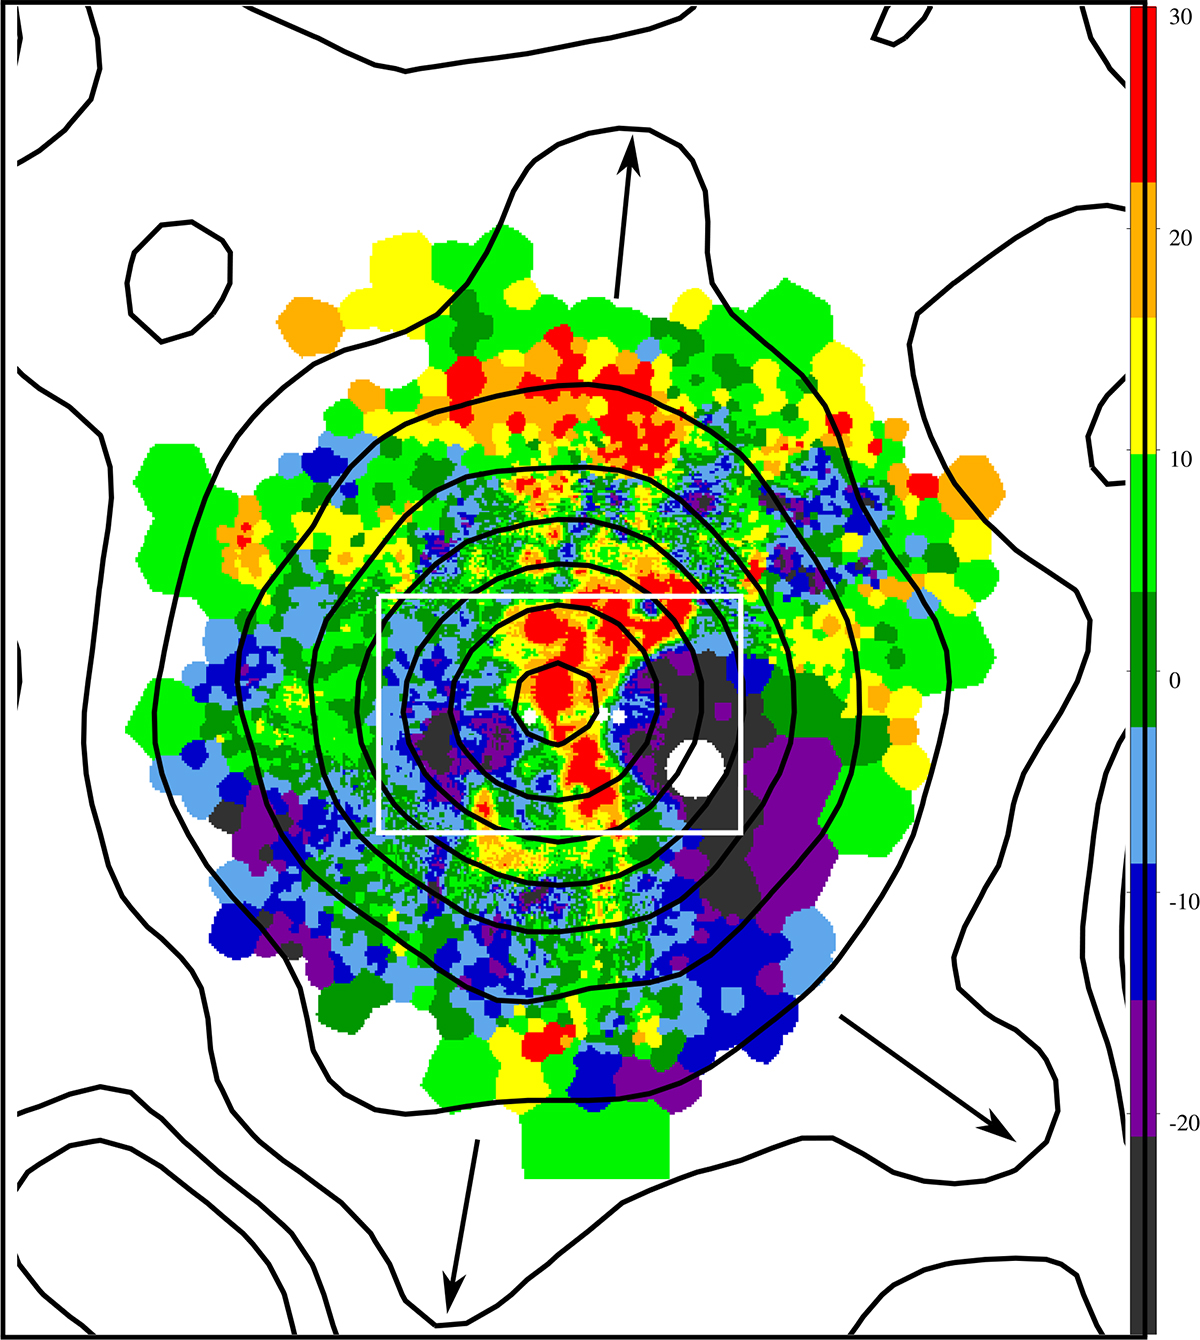
Fig. 7.
Download original image
Hα velocity map of ESO 338-4 presented in Bik et al. (2018). The color map indicates the blue- and redshifted regions from −30 to 30 km s−1. CL23 is located at the center of the image, at the base of the positive velocity structure. The image is oriented with north up and east to the left. We note the logarithmically scaled XMM-Newton count contours derived from the combined data set of Fig. 2 in black. The black arrows indicate three elongated soft X-ray features. One of them coincides with the direction of the northern outflow cone. With a white box, we indicate the extent of Fig. 1, highlighting the difference in scale between the diffuse X-ray emission in the halo and the extent of the galaxy.
Current usage metrics show cumulative count of Article Views (full-text article views including HTML views, PDF and ePub downloads, according to the available data) and Abstracts Views on Vision4Press platform.
Data correspond to usage on the plateform after 2015. The current usage metrics is available 48-96 hours after online publication and is updated daily on week days.
Initial download of the metrics may take a while.