Fig. 7.
Download original image
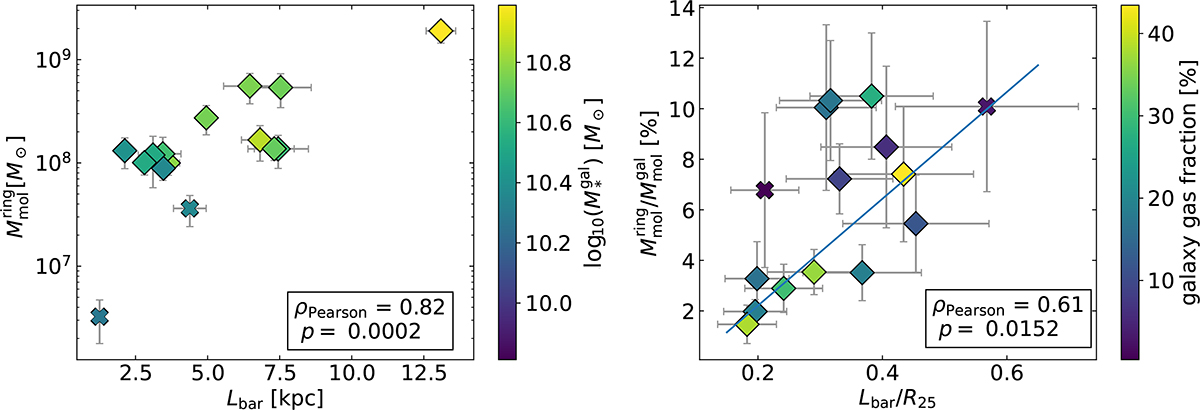
Left: dependence of the molecular gas mass in PHANGS central rings on the bar length. Data points are color-coded by their host galaxies’ stellar mass M*gal. Right: Dependence of the relative ring molecular gas content on the relative bar length, color-coded by their host galaxies’ gas fraction ![]() . The blue line is a linear fit to the data, obtained with the Python tool scipy.optimize.curve_fit. In both panels, the symbols follow Fig. 1 (barred spiral = diamond, barred ETGs = cross) and the Pearson correlation coefficients are provided in the bottom right.
. The blue line is a linear fit to the data, obtained with the Python tool scipy.optimize.curve_fit. In both panels, the symbols follow Fig. 1 (barred spiral = diamond, barred ETGs = cross) and the Pearson correlation coefficients are provided in the bottom right.
Current usage metrics show cumulative count of Article Views (full-text article views including HTML views, PDF and ePub downloads, according to the available data) and Abstracts Views on Vision4Press platform.
Data correspond to usage on the plateform after 2015. The current usage metrics is available 48-96 hours after online publication and is updated daily on week days.
Initial download of the metrics may take a while.