| Issue |
A&A
Volume 707, March 2026
|
|
|---|---|---|
| Article Number | A121 | |
| Number of page(s) | 17 | |
| Section | Extragalactic astronomy | |
| DOI | https://doi.org/10.1051/0004-6361/202557430 | |
| Published online | 02 March 2026 | |
Molecular gas and star formation in central rings across nearby galaxies
1
Max-Planck-Institut für Astronomie Königstuhl 17 D-69117 Heidelberg, Germany
2
National Astronomical Observatory of Japan 2-21-1 Osawa Mitaka Tokyo 181-8588, Japan
3
Sterrenkundig Observatorium, Universiteit Gent Krijgslaan 281 S9 B-9000 Gent, Belgium
4
Observatorio Astronómico Nacional (IGN), C/Alfonso XII 3 E-28014 Madrid, Spain
5
European Southern Observatory Karl-Schwarzschild Straße 2 D-85748 Garching bei München, Germany
6
Univ Lyon, Univ Lyon 1, ENS de Lyon, CNRS, Centre de Recherche Astrophysique de Lyon UMR5574 F-69230 Saint-Genis-Laval, France
7
Department of Astronomy, The Ohio State University 140 West 18th Avenue Columbus Ohio 43210, USA
8
Argelander-Institut für Astronomie, Universität Bonn Auf dem Hügel 71 53121 Bonn, Germany
9
Department of Physics, University of Alberta Edmonton AB T6G 2E1, Canada
10
Universität Heidelberg, Zentrum für Astronomie, Institut für Theoretische Astrophysik Albert-Ueberle-Str 2 D-69120 Heidelberg, Germany
11
Cosmic Origins Of Life (COOL) Research DAO, https://coolresearch.io
12
Department of Physics and Astronomy, University of Wyoming Laramie WY 82071, USA
13
Research School of Astronomy and Astrophysics, Australian National University Canberra ACT 2611, Australia
14
Universität Heidelberg, Interdisziplinäres Zentrum für Wissenschaftliches Rechnen Im Neuenheimer Feld 205 D-69120 Heidelberg, Germany
15
Harvard-Smithsonian Center for Astrophysics 60 Garden Street Cambridge MA 02138, USA
16
Elizabeth S. and Richard M. Cashin Fellow at the Radcliffe Institute for Advanced Studies at Harvard University 10 Garden Street Cambridge MA 02138, USA
17
Space Telescope Science Institute 3700 San Martin Drive Baltimore MD 21218, USA
18
Department of Physics, Tamkang University, No.151 Yingzhuan Rd. Tamsui Dist. New Taipei City 251301, Taiwan
19
Departamento de Física de la Tierra y Astrofísica, Universidad Complutense de Madrid E-28040, Spain
20
Como Lake centre for AstroPhysics (CLAP), DiSAT, Università dell’Insubria Via Valleggio 11 22100 Como, Italy
21
Department of Astrophysical Sciences, Princeton University 4 Ivy Ln. Princeton NJ 08544, USA
22
Department of Astronomy, University of Maryland 4296 Stadium Drive College Park MD 20742, USA
23
Sub-department of Astrophysics, Department of Physics, University of Oxford Keble Road Oxford OX1 3RH, UK
★ Corresponding author: This email address is being protected from spambots. You need JavaScript enabled to view it.
Received:
26
September
2025
Accepted:
29
December
2025
Abstract
Context. Nearby galaxies exhibit a variety of structures, including so-called central or (circum-)nuclear rings that are similar to the Milky Way (MW) Central Molecular Zone (CMZ). These rings are common in barred galaxies and can be gas-rich and highly star-forming.
Aims. We aim to study the molecular gas content and star formation rate of central rings within nearby galaxies and link them to global galaxy properties, especially the bar morphology.
Methods. We utilized 1″(≲100 pc) resolution CO(2–1) observations from the PHANGS-ALMA survey, visually identifying 20 central rings and determine their properties. For 14 of these rings, MUSE observations tracing star formation rate (SFR) surface density were available. We derived the rings’ geometry, integrated molecular gas masses, SFRs, depletion times, and compared them to host galaxy and bar properties from the literature.
Results. Molecular gas is an effective tracer for central rings. Previous studies have used ionized gas and dust tracers to identify central rings in galaxies of similar morphological types as the PHANGS galaxies (numerical Hubble type T ∼ −3 to T ∼ 9). In comparison, molecular gas yields similar fractions of galaxies hosting central rings and similar radii distributions. The gaseous central rings have typical radii of ∼ 400+250−150pc, molecular gas masses of log(M/M⊙) ∼ 8.1+0.17−0.23, and SFRs of ∼ 0.21+0.15−0.16 M⊙/yr. As a result, they contribute 5.6+4.5−2.1% and 13+10−5% to their host galaxies’ molecular gas mass and SFR, respectively. While the MW CMZ sits at the lower end of the radius, molecular gas mass, and SFR distribution, it matches well in terms of ring molecular gas mass and SFR fraction, and depletion time. Longer bars contain more massive molecular central rings, but there is no correlation between the classical bar strength parameters (Qb, εbar, A2max) and the ring’s molecular gas content.
Conclusions. Although absolute central ring properties (ring radius, molecular gas mass, SFR) likely depend on host galaxy properties, the similarities between the MW CMZ and PHANGS central rings in relative parameters (molecular gas and SFR fraction, depletion time) suggest that the processes of gas inflow and star formation are similar for central rings across nearby galaxies.
Key words: ISM: molecules / Galaxy: center / galaxies: ISM / galaxies: star formation / galaxies: structure
© The Authors 2026
 Open Access article, published by EDP Sciences, under the terms of the Creative Commons Attribution License (https://creativecommons.org/licenses/by/4.0), which permits unrestricted use, distribution, and reproduction in any medium, provided the original work is properly cited.
This article is published in open access under the Subscribe to Open model.
Open Access funding provided by Max Planck Society.
1. Introduction
Galaxies in the nearby universe display a large variety of structures such as spiral arms, bars, and various kinds of rings in their stellar and gaseous distributions (e.g., Kormendy & Kennicutt 2004; Binney & Tremaine 2008; Salo et al. 2015; Stuber et al. 2023, and many others). Here, we study extra-galactic central rings1, which are common features, especially in the centers of barred galaxies (Knapen 2005; Comerón et al. 2010; Stuber et al. 2023; Erwin 2024). Central rings have typical radii of a few 100 pc and, so far, they have mainly been identified as ring-like structures in the near-infrared, optical, or UV (e.g., via Hα, Paα; Maoz et al. 1996; Knapen 2005; Comerón et al. 2010). Central rings can have high surface densities of gas, young stars, and star formation. They are also subject to high rotational shears and might experience stellar and active galactic nucleus (AGN) feedback (Schinnerer & Leroy 2024). Thus, they can serve as examples for the most extreme environments for star formation (e.g., Levy et al. 2022). Furthermore, they may cause (gas) outflows affecting the evolution of their host galaxy in a substantial way (Leaman et al. 2019; Veilleux et al. 2020; Nguyen & Thompson 2022).
The Milky Way (MW) is thought to host a ring-like structure in its gas distribution with a radius of ∼100 − 200 pc, which is known as the Central Molecular Zone (CMZ; e.g., Molinari et al. 2011; Kruijssen et al. 2015; Henshaw et al. 2016a,b; Battersby et al. 2025a,b). Our location inside the galactic disk makes it difficult to determine the CMZ’s exact extent and to properly connect its several gas components (clouds), leaving its exact 3D geometry under debate (Kruijssen et al. 2015; Henshaw et al. 2016a, 2023; Walker et al. 2025; Lipman et al. 2025). Thus, studying extra-galactic central rings is both interesting in its own right and useful in improving our understanding of the MW CMZ. Among many topics, it allows us to examine star formation under extreme conditions, dynamical processes in the central regions of galaxies, and the connection between large-scale galaxy structure and star formation processes. Lastly, it can provide insights for the interpretation of the MW CMZ data. In this study, we determine the integrated properties of central rings, such as molecular gas masses and SFRs, and connect these with global properties of their host galaxies, such as their position on the star-forming main sequence (SFMS) of galaxies (Brinchmann et al. 2004; Noeske et al. 2007) and bar properties.
Bars are thought to form due to dynamical instabilities in rotationally supported disks (Sellwood & Wilkinson 1993) or due to (tidal) interactions of smooth rotating disks with other galaxies or a triaxial dark matter halo (Noguchi 1987; Kormendy & Kennicutt 2004; Łokas et al. 2014, 2016), and have typical sizes (semi-major axis) of 1 − 5 kpc (Díaz-García et al. 2016). They are mostly made up by the family of the commonly called x1-orbits stabilized by the bar’s self-gravity (Contopoulos & Papayannopoulos 1980). Depending on the shape of the disk potential and the bar pattern speed, resonances, such as the inner Lindblad resonance (ILR) can exist (e.g., Binney & Tremaine 2008; Ruiz-García et al. 2024) that have been linked to the presence of central rings (e.g., Schwarz 1984; Athanassoula 1992; Combes 1988, 1996; Buta & Combes 1996; Sormani et al. 2024). Molecular gas is often detected in bar lanes (or dust lanes), along the leading edge of the bar (e.g., Schinnerer et al. 2023. These lanes are the loci of shocks and lead to gas flows towards the center (e.g. Athanassoula 1992; Sormani et al. 2015). It has been suggested that strong bars are more efficient in bringing gas to the center (e.g., Schwarz 1981; Sellwood & Wilkinson 1993). The bar strength is often characterized via the non-axisymmetric torque parameter, Qb, which is the maximum normalized tangential force amplitude within the bar region (e.g., Laurikainen & Salo 2002; Díaz-García et al. 2016). Other measures of the bar strengths are bar ellipticity and Fourier amplitudes of a Fourier decomposition of the images (see Díaz-García et al. 2016, and references within).
It is interesting to investigate connections between bar parameters and central ring properties, as there is still no full consensus on the formation mechanisms for these rings. Most theories on central ring formation agree that (a) non-axisymmetric structures such as bars funnel gas to the center where (b) their non-axisymmetric potential plays an important role in rearranging the matter such that central rings are formed (e.g., Sormani et al. 2024). Therefore, central rings are mostly expected within bars, although strong spiral arms or interactions with companion galaxies may induce ring formation too (e.g., Comerón et al. 2010). Central rings are traditionally thought to form at or near the ILR, typically composed by the family of x2-orbits2 in non-axisymmetric (bar) potentials (e.g., Buta & Combes 1996; Li et al. 2015; Sormani et al. 2024).
High-resolution radio images (∼1″ ≃ 100 pc at a distance of 20 Mpc) of galaxy centers have been obtained by several studies focusing on individual galaxies or small galaxy samples (e.g., García-Burillo et al. 2003; Callanan et al. 2021; Sun et al. 2024). Recently, the Physics at High Angular resolution in Nearby GalaxieS survey (PHANGS3; Leroy et al. 2021b) has provided comparable images for a large sample (90) of nearby galaxies as part of the PHANGS-ALMA large program (Leroy et al. 2021b). Stuber et al. (2023) used the PHANGS-ALMA data to study the CO morphology of nearby galaxies, identifying central rings in ∼30% of these galaxies, the majority of which are barred. With the same dataset, it is possible for the first time to study these molecular central rings in detail, yielding molecular gas masses and star formation rates based on the CO ring geometry. This also provides observational constraints for theories of central ring formation and the statistics needed for studying systems similar to the MW CMZ.
The structure of this paper is as follows: In Sect. 2, we present the data from the PHANGS survey used in this study, and define our sample of central rings. The analysis procedure is explained in detail (Sect. 3) before moving on to the results in Sect. 4. We present several properties of PHANGS central rings, compare them with the MW CMZ properties, and investigate correlations between literature bar parameters and central ring molecular gas mass. Finally, in Sect. 5, we discuss the results and some caveats of this study. Our conclusion is given in Sect. 6.
2. Data
The PHANGS survey provides the ideal dataset for studying star formation processes in a variety of structures in galaxies with different morphologies. PHANGS investigates 90 nearby galaxies associated with the z = 0 main sequence of star-forming galaxies (see, e.g., Noeske et al. 2007 and Fig. 1). The selected galaxies are massive (stellar mass of 9.5 < log(M*/M⊙) < 11.0), actively star-forming (specific SFR of log(sSFR/yr−1) > − 11), relatively nearby (d ≤ 23 Mpc), not overly edge-on (i < 75°), and with a declination within −75° < δ < +25° (so that they can be observed by telescopes in the southern hemisphere). For more details on the sample selection, we refer to Leroy et al. (2021b).
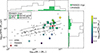 |
Fig. 1. Global SFR as a function of global stellar mass for our sample galaxies from the PHANGS-ALMA sample. Solid and dashed black lines denote the main sequence of star-forming galaxies with a scatter of 0.36 dex, as given by Leroy et al. (2019). The PHANGS galaxies with central rings are color coded by the central ring gas mass as obtained in this study and the different symbols denote barred spiral (diamond) and unbarred spiral (open diamond) galaxies, barred early-type galaxies (ETGs, cross), and unbarred ETGs (open cross). The MW is plotted as a black dot with red errorbars. |
2.1. PHANGS-ALMA data
The PHANGS-ALMA dataset covers observations of the rotational J = 2 → 1 CO emission line, which can be used as a tracer for the most abundant molecule, H2. It contains high-resolution (∼1 ″ corresponding to ≲100 pc at d ≲ 20 Mpc) data cubes of CO(2–1) emission observed with a combination of the ALMA 12 m and 7 m arrays and the total power antennas, that recover CO emission from all spatial scales. For detailed information about the data reduction and imaging process see Leroy et al. (2021a). We use the “broad mask” versions of the integrated intensity maps, which achieve high completeness, that is, including almost all emission, at the expense of a lower signal-to-noise ratio (S/N). From the CO(2–1) maps, we can obtain the molecular mass of a region,  , using the expression,
 (1)
(1)
with Σmol, px denoting the molecular gas surface density per pixel on the sky,  being the CO(2–1) integrated intensity per pixel, Apx denoting the pixel size in units of physical area (kpc2), and αCO is a conversion factor between CO emission and molecular gas mass with units of a mass-to-light-ratio. In this study we use maps of
  created by Sun et al. (2025) using the prescription by Schinnerer & Leroy (2024). This prescription attempts to account for excitation variations, emissivity variations, and metallicity effects (spatially varying both within individual galaxies and between galaxies) based on synthesizing work by Bolatto et al. (2013), Accurso et al. (2017), Gong et al. (2020), Sun et al. (2020, 2022), den Brok et al. (2021), Hu et al. (2022), Leroy et al. (2022), Teng et al. (2023), Chiang et al. (2024). The error on these
  maps are on the order of ∼0.2 − 0.3 dex based on comparisons with observational estimates (Sun et al. 2025).
2.2. PHANGS-MUSE – ΣSFR maps
For 51 PHANGS galaxies, including 14 with central rings, maps of star formation rate surface density (ΣSFR) were made available. They were derived from Hα emission from MUSE archival data and the sample from Belfiore et al. (2023) and their resolution reaches the common optimum (copt) resolution of MUSE (∼(0.95 ± 0.16) ″, depending on the observing conditions, Emsellem et al. 2022). The copt resolution was obtained by convolving the data at all wavelengths and from all pointings within a mosaic to a common angular resolution image of a galaxy. All maps were derived by correcting the observed Hα emission for dust attenuation based on the Balmer decrement and then converting it into ΣSFR maps using the conversion factor from Calzetti et al. (2007, for details, we refer to Belfiore et al. 2023). This is expressed as
 (2)
(2)
This conversion factor was computed with Starburst99 (Leitherer et al. 1999), assuming a constant star formation history, an age of 100 Myr, solar metallicity, and a Kroupa (2001) initial mass function (IMF).
2.3. Host galaxy and bar properties
The host galaxy properties derived and compiled by Leroy et al. (2021b) are provided in Table 1. For 15 of the 20 galaxies with central rings, the deprojected bar semi-major axis as a measure for the bar length, Lbar, and the bar ellipticity, εbar, were measured by Herrera-Endoqui et al. (2015), while the bar maximum gravitational torque, Qb, and the bar maximum normalized m = 2 Fourier amplitude, A2max, were determined by Díaz-García et al. (2016).
Host galaxy properties.
3. Central ring identification and measurements
3.1. Sample selection
We visually selected a sample of central rings from the original PHANGS-ALMA sample (Leroy et al. 2021b) using the following criteria: (a) the available moment-0 map must have an angular resolution of ∼1 ″, corresponding to ≲100 pc at distances ≲20 Mpc; thus, the central rings with a radius of r > 100 pc can, in principle, be resolved, which reduces our parent sample to 81 PHANGS-ALMA galaxies. (b) In the molecular gas distribution a central ring-like structure must be visible with a clearly identifiable shape and size. This means we must be able to resolve substructure within the ring-region, namely, either a hole in the center (e.g., NGC 4476 and NGC 4477; see Fig. 3) or a central emission component clearly distinct from the ring around it (e.g., NGC 1097, NGC 1512). This excludes galaxies where we only see a central gas concentration and galaxies with diffuse and/or clumpy central emission where we cannot reliably define a ring-like distribution. As central rings can have different geometries (e.g., Jiménez-Sánchez et al. 2025), we consider the following geometries: (i) “classical” circum-nuclear ring within a bar; (ii) tightly wound spiral arms forming a pseudo-ring; and (iii) other types of rings. We did not apply a morphological cut for the host galaxies, but we did include central rings in both spiral and early type galaxies that are part of the PHANGS-ALMA sample. See also Appendix A for comments on the individual rings in our sample.
Stuber et al. (2023) already carried out a first classification of different structures in the molecular gas distribution of the PHANGS-ALMA sample, including central rings. We compare their classification based on the two before-mentioned criteria and confirm 20 out of 22 central rings reported by Stuber et al. (2023). The two central rings in Circinus and NGC 1068 listed in Stuber et al. (2023) do not fulfill our criterion for the data resolution, as these galaxies were observed with ALMA’s 7 m array and total power antennas only. Therefore, they were not considered in this work.
Maps of ΣSFR are available for 14 of these 20 galaxies (see Sect. 2.2) and are used to derive SFRs and depletion times tdep = Mmol/SFR in the central rings. In Table 2, the identified central rings along with their measured properties are provided. In Fig. 1, all galaxies in this study are shown at their location with respect to the main sequence of star-forming galaxies along with the full PHANGS galaxy sample. Almost all our central rings are found in rather massive galaxies (log(M*/M⊙) > 10.1), which is in agreement with observations by Fraser-McKelvie et al. (2020) and simulations carried out by Verwilghen et al. (2024, see our Sect. 5.4 and Emsellem, in prep.).
Central ring properties.
3.2. Determination of ring geometry
We used the SAOImageDS96 tool (hereafter DS9) to visually determine the elliptical annuli that best describe the shape of central rings in the molecular gas distribution as traced by CO(2–1). We used the projected images of the galaxies to avoid introducing uncertainties by deprojection.
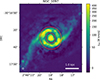 |
Fig. 2. Molecular gas distribution of the galaxy NGC 1097. The different ellipses represent the best elliptical annulus (red, solid line) and uncertainty ellipses (black, dashed lines), indicating emission which is definitely ring material (narrower annulus: strict mask) and emission that might still be ring material (wider annulus: broad mask). The white circle in the lower left corner indicates the beam size and a scalebar is provided in the lower right. The color bar indicates the integrated intensity in terms of the brightness temperature. |
An elliptical annulus can be described by seven parameters: major and minor axes of both the inner and outer ellipse (hin/out and win/out), position of the center (xc, yc) of the ellipses, and their position angle (PA). We allowed the inner and outer ellipse of the ring region to have different ellipticities, ε = 1 − w/h, as the inner and outer boundary of the central rings can have different shapes (see Fig. 3). As a default, we used the host galaxy centers as the center for the ellipses. For 12/20 central rings, we needed to slightly shift (mostly 0.5 − 1.5″) the center to correctly capture the molecular gas distribution.
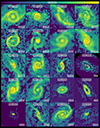 |
Fig. 3. Gallery of central rings identified in a sample of 81 PHANGS-ALMA galaxies. The galaxy name is given at the top of each panel. All panels have the same physical size of 3 × 3 kpc2, but with differing color stretches. The minimum and maximum intensity is listed at the bottom right of each panel. The best elliptical annulus (see Sect. 3.2) is plotted in red and the beam size is plotted in white in the lower left corner. |
Using different color stretches in DS9, we determined the heights, widths, and PAs that best describe the central rings (i.e., the best ellipses; see Fig. 2). Similarly, the uncertainty ellipses for such best rings were identified by defining an ellipse that contains all the molecular gas emission that might be still ring material (i.e., broad uncertainty ellipses) and a second one that only captures emission that is definitely in the ring (i.e., strict uncertainty ellipses). As the resolution of the ALMA data is set by the beam size (see Leroy et al. 2021a), we defined the uncertainty ellipses to differ from the nominal best ring at least by 0.5 times the beam size. The PAs for the uncertainty annuli are the same as for the best ones, as varying the PA introduces only a small error compared to the one introduced by varying the annulus width. The determined ellipse parameters for the rings are presented in Appendix B. The central ring radius, rring, is the deprojected mean of the outer and inner best semi-major axes, as given in Table 2.
3.3. Central ring molecular gas mass
We use the integrated quantities ( , SFRring) as indicators of the ring properties since they are more robust than surface densities of molecular gas and star formation against the exact determination of the ring shape and presence of regions of low surface density (e.g., the ring edges). In particular, the ring area in the galaxy plane is sensitive to the inclination and its uncertainty, which we wanted to avoid.
We obtained the molecular gas mass of the central ring with Eq. (1), applied to the area of the ring (elliptical annulus; see Sect. 3.2). The error on the central ring molecular gas mass is dominated by the uncertainty from varying the ring shape (i.e., from integrating the broad and strict uncertainty annuli). Taking the mean of the two provides a first component of the uncertainty,  . We used noise maps,
  , for the CO(2–1) moment-0 maps (Leroy et al. 2021a) to obtain a second uncertainty component based on standard Gaussian error propagation,
 (3)
(3)
The uncertainty on the distance affects the pixel size, Apx, and, thus, the central ring molecular gas mass, giving the third uncertainty component,  . The three uncertainty components were then added in quadrature yielding the total uncertainty
  . The
. The  determination has an uncertainty of ∼0.2 − 0.3 dex (Sun et al. 2025) depending on the exact prescription used. Given that this is a systematic bias, we did not include it in our error calculations here and we discuss the effect of using different prescriptions for αCO separately in Sect. 5.3.
3.4. Central ring SFRs
For the 14 galaxies of our ring sample with SFR maps (see Sect. 2.2), the central ring SFR was measured analogously to the molecular gas mass. We applied the same elliptical annular masks to the ΣSFR maps and integrate the SFR surface density over the area of the central rings. The uncertainty determination is similar to the one described in the previous section: the uncertainty on the central ring shape is applied here in the same way, the ΣSFR maps also have associated error maps that must be taken into account, and the distance error also affects the area.
3.5. Central ring sample
Central rings are easily formed in simulations of barred galaxies (e.g., Athanassoula 1992; Kim et al. 2012; Sormani et al. 2024), and many others) and observations show that they are found preferentially in barred galaxies (Knapen 2005; Comerón et al. 2010; Stuber et al. 2023). Interestingly, both Stuber et al. (2023) and this study identify small ring-like features in the centers of the three non-barred galaxies NGC 29976, NGC 4459, and NGC 4476. These central rings might have formed by a different mechanism than the classical central ring induced by a non-axisymmetric potential and, thus, they might not be directly comparable with the latter. Furthermore, as our aim here is to investigate all ring-like central structures within the PHANGS sample (see Sect. 3.1), we might have also included so-called pseudo-rings, made up of tightly wound spiral arms. These rings might not be directly comparable with the so-called classical central ring. In total, five of the central rings we identified are found in early type galaxies (NGC 3489, NGC 4459, NGC 4476, NGC 4477, and NGC 7743; see Sect. 3.1 and Appendix A) and their gas dynamics might differ from those in late-type spiral galaxies, given the larger importance of the stronger stellar potential relative to gas self-gravity (e.g. Davis et al. 2013; Meidt et al. 2018; Liu et al. 2021), which tends to lead to a smoother gas structure and morphology (Davis et al. 2022). Therefore, the rings found in ETGs are highlighted throughout the following analysis.
The molecular gas distribution of all central rings identified in the PHANGS-ALMA sample often exhibits bar lanes for the barred galaxies (see Fig. 3). We comment on each individual central ring in Appendix A.
Central ring properties: medians and ranges.
4. Results
We present the results on central ring properties and compare them with literature values for the MW CMZ. This will not only improve our understanding of central rings in different environments, but the interpretation of the MW CMZ data in the context of nearby normal star-forming galaxies. We further compared our ring fractions and radii to literature findings; in particular, the largest literature sample of central rings, the Atlas of Images of Nuclear Rings (AINUR, Comerón et al. 2010), which used UV, Hα, and Paα as tracers for star-forming rings, as well as color-index and structure maps (Pogge & Martini 2002) for detecting dust rings. Furthermore, we tested for expected correlations between the central ring molecular gas mass and literature bar parameters.
4.1. PHANGS central ring properties
In Table 3, we list the properties of the central rings across our sample. We give median values and ranges for both the whole sample and the sample without the ETGs (spirals only), as we later compared the MW CMZ only with the central rings found in spiral galaxies. The interquartile ranges in the table are given as uncertainty values on the median. The distributions of these central ring properties along with the respective values for the MW CMZ are also presented as violin plots in Fig. 4.
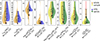 |
Fig. 4. Distributions of central ring parameters (from left to right): Radius, rring, relative radius, rring/r25, molecular gas mass, |


The radii of PHANGS central rings are obtained by deprojecting the mean of the outer and the inner best semi-major axes. Due to the resolution limit, we might have missed central rings with radii ≲100 pc, (see Sect. 2.1). An upcoming work by Neumann (in prep.) and Emsellem (in prep.) will probe a possible population of central rings with r ≲ 100 pc, using higher resolution JWST observations.
The central rings in PHANGS have molecular gas masses of typically ∼108.1 M⊙ and contain ∼1.5 − 10.5% of the total molecular gas mass of the galaxy, except for NGC 4476 (with (60 ± 17)%) and NGC 4477 (with (25 ± 10)%). Both are ETGs and are expected to behave differently than spiral galaxies (Davis et al. 2013, 2022; Williams et al. 2025). The 14 central rings with high resolution ΣSFR maps from MUSE have SFRs of ∼0.21 M⊙/yr, contributing ∼1 − 25% to their host galaxy’s SFR. We checked whether the sample with available SFR maps is representative of the whole ring sample by comparing the radius and molecular gas mass distributions of the respective (sub)samples and find that the central rings with SFR maps have slightly larger radii (550 ± 240 pc instead of  pc), while the overall radius and molecular gas mass distributions do not change substantially (see Appendix C).
4.2. MW CMZ properties
The central ∼1 kpc of the Milky Way (MW) hosts several different structures identified in its molecular gas distribution, with the CMZ being a ring-like structure that is similar to extragalactic central rings (see review by Henshaw et al. 2023). As the MW is a barred spiral galaxy, we compared the MW CMZ properties with properties of PHANGS central rings that reside within spiral galaxies.
The CMZ has a radius of ∼100 − 200 pc7 (Henshaw et al. 2023) and, therefore, it is smaller than PHANGS central rings in spiral galaxies. However, there might be a population of rings within this radius range in PHANGS-ALMA, which could not be detected due to the resolution limit8. Thus, the MW CMZ might turn out to be within the distribution if higher resolution data were available.
The MW CMZ has a molecular gas mass of  (Mills 2017), and using 6.5 × 10⁸ M⊙ (Roman-Duval et al. 2016) for the total molecular gas mass of the Milky Way, its molecular gas mass fraction is
  (comparable to ∼5% in Mills 2017). Therefore, while its mass is lower than that of PHANGS central rings in spirals, it contains a similar fraction of the molecular gas of the host galaxy as our ring sample.
The CMZ has an SFR of  (Henshaw et al. 2023). Comparing this value to the SFR of the entire MW of (1.9 ± 0.4) M⊙/yr (Chomiuk & Povich 2011), this corresponds to an SFR fraction of
  %. Thus, the MW CMZ’s SFR and SFR fraction is on the low-end side (but still within) the PHANGS central ring SFR distribution. The depletion time of the MW CMZ is
  Gyr (Henshaw et al. 2023). This is well within the range of depletion times derived for PHANGS central rings.
4.3. Central ring fraction and radii: Comparison to AINUR
AINUR (Comerón et al. 2010) is a comprehensive study of 113 central rings in 107 galaxies as traced by UV, Hα, Paα, color-index, and structure maps (derived from HST data). In the following, we compare our results to the literature findings, in particular, from AINUR.
Comerón et al. (2010) reported that (20 ± 2)% of disk galaxies (with morphological types between T = −3 and T = 7, similar to PHANGS morphological types between T = −2.9 and T = 9) harbor central rings, which is similar to our central ring fraction of (25 ± 4)%. In addition, Knapen (2005) determined a similar fraction of (21 ± 5)% of disk galaxies to host central rings when using ground-based, narrowband Hα as tracer, while Erwin (2024) reported a fraction of (20 ± 3)% of barred S0 -Sd galaxies to host central rings. Using the same sample as in the present study, Stuber et al. (2023) reported a central ring fraction of (31 ± 4)% (and (45 ± 7)% in barred galaxies), where the slightly higher number comes from their selection criteria: they pre-selected the galaxies based on the visibility of the disk in molecular line emission, obtaining 72 valid galaxies for the classification.
A closer comparison with AINUR shows that most molecular central rings have a direct counterpart seen in Paα or Hα emission, with only a few central rings where the studies display a disagreement: Comerón et al. (2010) reported central rings for the PHANGS galaxies NGC 1068, NGC 1317, NGC 4571, NGC 4579, and NGC 4826, but we did not include these in our sample; either because the resolution was too poor (NGC 1068; see Sect. 3.1), no molecular central ring was identified (NGC 1317, NGC 4571), the ring shape was unclear (NGC 4579), or only unresolved emission was present in the center, which might end up resolved as a ring with higher-resolution imaging (NGC 4826, rAINUR = 150 pc).
On the other hand, our ring sample includes NGC 1365, NGC 2566, NGC 3498, NGC 4476, NGC 4477, and NGC 7743, which are not reported by Comerón et al. (2010). This is because the ring is obscured by dust (NGC 1365), they considered it as a pseudo-ring (NGC 2566), the host galaxy was too inclined (NGC 3498), no HST data were available (NGC 4476, NGC 7743), or no obvious ring in the HST images was detected (NGC 4477, Comerón, priv. com.). For all other 71 galaxies in the PHANGS survey, especially the remaining 14 with central rings, AINUR and this study are in agreement.
The ring radii in AINUR span a range of ∼50 − 2000 pc with more rings at the low-end of the distribution (see Fig. 4 in Comerón et al. 2010). As AINUR made use of HST images with a resolution of ∼0.1″ (Comerón et al. 2014) a population of smaller central rings can be identified. Nevertheless, our sample exhibits a similar behavior with more small central rings than larger ones (see Fig. 5), and a two-sample Kolmogorov–Smirnov test between the AINUR and our measured radii yields a pKS value of 27.3%> 5%, suggesting that the two samples are not significantly different. Indeed, direct comparison of the radii shows that almost all our radius measurements agree within 2σ with those from AINUR (compare Table 2 and Table A2 in Comerón et al. 2010). The exception is the central ring in NGC 1433, where the CO geometry within the ring region is more complex than just a ring plus a central emission component (see Fig. 3). Therefore, different studies might come to different conclusions about the position of the central ring.
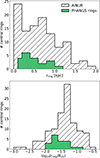 |
Fig. 5. Distribution of the absolute central ring radius (upper panel) and the ring radius relative to the disk size as measured by r25 (lower panel). The green histogram shows the sample of central rings in this study while the white histogram shows the ring sample of AINUR (Comerón et al. 2010). |
The central ring radii relative to the disk size as measured by the 25th magnitude isophotal B-band radius, r25, show a similar behavior in this study and in AINUR9 with most central rings residing within r25/100 ≤ rring ≤ r25/10. AINUR reported a peak of the distribution at log(rring/r25)≈ − 1.3, while we found the peak at ≈ − 1.7 (Fig. 5). In summary, our results for the central ring fractions and radii are consistent with the ones found in the literature, especially from the largest literature sample of central rings, AINUR.
4.4. Central ring properties along the SFMS
From Fig. 1, it is already evident that central rings occur preferentially in massive galaxies with stellar masses of log(M*/M⊙) > 10, consistent with hydrodynamical simulations (Verwilghen et al. 2024) and observations (Comerón et al. 2010, using stellar mass measurements from the z = 0 Multiwavelength Galaxy Synthesis project (z0MGS), Leroy et al. 2019; Fraser-McKelvie et al. 2020). The exception is the early-type galaxy NGC 4476 with a stellar mass of log(M*/M⊙) = 9.81, which is still close to 1010 M⊙. Furthermore, as it is an ETG, it exhibits different dynamics than (barred) spirals and its central ring might not be comparable with the other ones10 (Sect. 3.5).
Furthermore, there is a correlation between  and M*gal with a Pearson correlation coefficient11 of ρPearson = 0.86, with a corresponding p value of p < 10−4 which is, thus, statistically significant: the central rings with more molecular gas are found in more massive galaxies. This is not surprising as more massive galaxies generally tend to harbor more massive structures.
In addition, the offset from the main sequence, ΔMS, and  are statistically significant correlated with a Pearson-correlation coefficient of ρPearson = 0.48 and the corresponding p value of p = (3.2 ± 1.8)% (see Fig. 6). The central rings with little molecular gas are found below the SFMS, while the ones with more molecular gas are found above it. This correlation is likely inherited from a correlation between
  and ΔMS (with ρPearson = 0.74 and p = (0.02 ± 0.02)%), as we found a relatively flat
  across our sample (with few exceptions; see Fig. C.2).
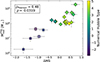 |
Fig. 6. Dependence of the molecular gas mass in PHANGS central rings on the offset from the main sequence ΔMS. The symbols follow Fig. 1 (barred spiral = diamond, unbarred spiral = open diamond, barred ETGs = cross, and unbarred ETGs = open cross). Pearson correlation coefficient is listed in the top left. Data points are color-coded according to the host galaxies’ numerical Hubble Type. |
We found no reliable correlation between ΔMS and the molecular gas fraction within the ring ( ) or between ΔMS and the ring depletion time (Appendix C). Here, we note that the small number of central rings in our study limits the conclusions that can be drawn. In particular, the limited sample of 14 central rings with SFR maps caused further correlations we considered (e.g., between the ring’s molecular gas masses and their SFRs) to be unreliable.
4.5. Bar parameters and 
Theory and simulations (e.g., Athanassoula 1992; Sormani et al. 2015, 2024; Verwilghen et al. 2024) imply that bars funnel gas to the center of galaxies, which has also been corroborated observationally (e.g., Sakamoto et al. 1999a; García-Burillo et al. 2005; Sheth et al. 2005; Querejeta et al. 2016). Due to the interplay of (bar) nonaxisymmetric potential, orbital angular momentum, and gas pressure forces, the gas settles into the ring-like structures studied here. Therefore, it is conceivable to expect a correlation between bar parameters and the molecular gas content of central rings.
For the 15 galaxies with measured bar parameters (Herrera-Endoqui et al. 2015; Díaz-García et al. 2016), we found a positive correlation between the bar length (semi-major axis) and the molecular gas content (Fig. 7, left panel). Thus, we found indeed that central rings with a larger molecular gas mass are found within longer bars. However, this correlation is likely inherited from a correlation between bar length and host galaxy stellar mass (Erwin 2019) and between galaxy stellar mass and central ring molecular gas mass (Fig. 1, Sect. 4.4). To understand the central ring funneling mechanisms independently of global galaxy scaling relations, it is more useful to consider relative parameters. Specifically, when considering the central ring molecular gas fraction,  , as a function of the relative bar length to the disk size, Lbar/r25, we obtained a Pearson correlation coefficient of ρPearson = 0.61, with a corresponding p value of p = (1.5 ± 9)%, which suggests that this correlation is not very stable against resampling within the error bars. We found no significant influence of stellar mass M*gal of the galaxy or the galaxy gas fraction,
  , on this (moderate) correlation. Similarly, no correlations emerge between the relative12 molecular gas content of the rings,
  , and the classical parameters for bar strength (p > 5%; see the figures in Appendix C).
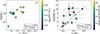 |
Fig. 7. Left: dependence of the molecular gas mass in PHANGS central rings on the bar length. Data points are color-coded by their host galaxies’ stellar mass M*gal. Right: Dependence of the relative ring molecular gas content on the relative bar length, color-coded by their host galaxies’ gas fraction |
5. Discussion
5.1. Molecular gas as tracer for central rings
The similar central ring fraction reported in this paper and in the literature using HST images and H recombination lines (Knapen 2005; Comerón et al. 2010) implies that molecular gas traces central rings equally well as star-formation, dust, and ionized gas (all used by Comerón et al. 2010, the latter also by Knapen 2005). This is seen in UV imaging, color index and structure maps, or Paα and Hα, respectively. This is corroborated by the similar radius distributions of central rings found in this study and AINUR. The comparison between different tracers has become possible due to the unprecedented resolution of CO(2–1) maps taken with ALMA, reaching a similar resolution than only optical observations (e.g., ground-based narrowband Hα) before. We conclude that the choice of tracer (molecular lines, H recombination lines, and optical and near-IR HST images) does not influence the detection and visual identification of central rings.
Having said this, we speculate that there are other effective ways of detecting molecular central rings in nearby galaxies. Especially JWST allows for the use of dust or polycyclic aromatic hydrocarbon (PAH) emission to trace galaxy structures at high resolution. Given the smoother appearance of central rings in such maps, the application of automated radial flux analysis and central ring geometry identification can allow for more consistent determination than with the visual detection adopted here. Upcoming work by Neumann (in prep.) and Emsellem (in prep.) will further explore steps in this direction.
5.2. The MW CMZ is not a special central ring
This study confirms the notion of central rings as extreme environments for star formation (e.g., Schinnerer & Leroy 2024): They have relative radii of 0.01 − 0.1 r25 (both in this work and in Comerón et al. 2010), which corresponds roughly to an area of 0.01 − 1% of their host galaxy’s disk, but contain normally ∼1 − 10% of the galaxy’s molecular gas reservoir and contribute ∼1 − 25% of the star formation rate. This agrees with earlier observations (e.g., Comerón et al. 2010; Querejeta et al. 2021) and simulations (e.g., Athanassoula 1992; Seo & Kim 2013; Armillotta et al. 2019; Moon et al. 2021; Verwilghen et al. 2024, and many others), which find enhanced molecular gas surface densities and SFRs in the centers of galaxies. In addition, the average central ring depletion time (mostly < 1 Gyr) is shorter than the typical depletion time in galaxy discs (normally ∼1 − 2 Gyr), as also found in previous observational studies (e.g. Querejeta et al. 2021; Teng et al. 2024; Leroy et al. 2025).
We find that when compared to central rings in PHANGS spiral galaxies, the MW CMZ is smaller and less massive, but apart from this it is not special. Specifically, it exhibits similar star-formation properties (SFR fraction and tdep) and hints toward a similar funneling dynamics by the bar (molecular gas fraction) than extragalactic central rings.
This is interesting as many studies suggest that the MW CMZ is under-producing stars (e.g., Longmore et al. 2013; Kruijssen et al. 2014; Henshaw et al. 2023, and references within). While it roughly falls on the Schmidt-Kennicutt (S–K) relation (depending on its assumed geometry; for details see Henshaw et al. 2023), it produces by an order of magnitude fewer stars than expected from the so-called dense gas star formation relation (Gao & Solomon 2004; Longmore et al. 2013; Kruijssen et al. 2014; Barnes et al. 2017). Processes such as turbulence, magnetic fields, or tidal shear are thought to suppress the formation of stars from the dense molecular gas present in the MW CMZ (e.g., Kauffmann et al. 2013; Krumholz & Kruijssen 2015; Mills 2017; Moon et al. 2023; Henshaw et al. 2023). Given the clear similarities between extragalactic central rings and the MW CMZ, we suggest that such processes are at play in PHANGS central rings as well.
5.3. The role of bars and αCO
The importance of bars for central ring formation in theory and simulation is underlined by our study, where most central rings reside in barred galaxies: 17 out of 20 central rings are found within bars13. Using 15 galaxies with bar parameters available (Herrera-Endoqui et al. 2015; Díaz-García et al. 2016), we find that longer bars contain more massive rings (Fig. 7, left panel). There is only tentative evidence to support any correlation between relative bar length and fraction of molecular gas within the central rings (Fig. 7; p = (1.5 ± 9)%) as the relatively large uncertainties for  and Lbar/r25 significantly affect our derived p-value uncertainties. Our conservative approach to determine the uncertainty on ring properties (see Sect. 3.2) might have, in particular, overestimated the uncertainty (assumed to be a 1σ standard deviation) on
  . Thus, a more accurate determination might allow us to confirm a correlation.
Another factor influencing the correlation is the adopted conversion factor. Using the Bolatto et al. (2013)αCO prescription instead of that of Schinnerer & Leroy (2024) changes the Pearson correlation coefficient to ρPearson = 0.74, with a corresponding p value of p = (0.2 ± 3.6)% < 5%. Therefore, the adopted conversion factor has a relevant effect on the measured correlations, although different αCO prescriptions agree within their error bars with each other (∼0.2 − 0.3 dex, Sun et al. 2025).
The moderate correlation between relative bar length and central ring molecular gas fraction hints at a (simplified) central ring fueling scenario. If the bar is longer, it sweeps out a larger area of the galactic disk and gathers more gas within the disk. This gas can be funneled to the center and might lead to the higher central ring molecular gas mass fraction.
However, this notion neglects several dynamical effects that are important for ring fueling: First, the central ring size is thought to be connected with the x2 orbits, which scale with both the bar length and the central mass concentration (i.e., the total mass within the center region). When examining this, we find no correlation between ring molecular gas mass and size (ρPearson = 0.45, p = (5.4 ± 6.6)%) and only a moderate correlation between bar length and ring size (ρPearson = 0.58, p = (2.4 ± 3.3)%). Thus, we exclude this theoretical scaling between ring size and ring gas mass to cause the  correlation.
Another crucial factor is time evolution, as ring fueling is not constant, but rather subject to episodic accretion (e.g. Callanan et al. 2021; Sormani & Barnes 2019), for M83 and the MW CMZ). Furthermore, bars live longer than a bar rotation (de Sá-Freitas et al. 2025) and, therefore, the amount of gas that can be funneled inwards most likely depends on the gas reservoir at (and beyond) the bar ends – and not on only the gas mass in the disk region swept up by the bar, as we propose in this simplified ring fueling scenario. We conclude that central ring fueling is more complex, but that bar length likely plays a role.
While there are theoretical expectations that bar strength regulates the molecular gas content in galaxy centers, namely, stronger bars are believed to funnel gas more efficiently to the center (e.g., Schwarz 1981; Sellwood & Wilkinson 1993), we find no correlation between the classical bar strength parameters and the central ring molecular gas mass fraction. Thus, we cannot confirm the notion of stronger bars funneling gas more efficiently to the center.
5.4. Central rings on the SFMS: Stellar mass limit on ring formation
Hydrodynamical simulations of PHANGS-like galaxies show a minimum galaxy stellar mass for the formation of central rings or central gas reservoirs (Verwilghen et al. 2024, 2025). This is consistent with our findings that central rings almost only appear within galaxies with M* > 1010 M⊙14. Verwilghen et al. (2024) explained this behavior with the balance of supernovae (SN) feedback and the gravitational potential: In lower mass galaxies, the gravitational potential is not strong enough to counteract the SN feedback driving a gas outflow from the central regions, which leads to the depletion of gas before a ring can be formed. In higher mass galaxies, the gravitational potential overcomes the SN feedback and central rings can form.
Interestingly, the central rings’ molecular gas mass correlates positively with the offset from the main sequence. As this trend is driven by ETGs (with ΔMS < −0.5) that behave differently than normally star-forming spiral galaxies (Davis et al. 2013; Williams et al. 2025), it is difficult to determine if the trend is due to the different morphology or due to other galaxy properties.
The central ring depletion time exhibits a different behavior: When including the ETGs, there is no correlation between ΔMS and tdep (ρPearson = −0.13 and p = (66 ± 15)%), but without ETGs, the p value decreases to p = (4 ± 7)%. While this correlation is tentative in our data, future investigations would be useful, especially in light of the model proposed by Tacchella et al. (2016) for high-redshift galaxies: galaxies are confined to a narrow (±0.3 dex) star-forming main sequence due to cycles of gas depletion and replenishment that cause galaxies oscillating around the main sequence before eventually being quenched. This leads to gradients of the gas fraction, depletion time, and gas density across the main sequence (especially for galaxy centers). This model could also explain the large range of values of  , SFRring, and
  , spanning more than one order of magnitude for central rings in spiral galaxies (see Fig. 4). Future investigations on this require larger samples spanning a wider parameter range in the SFR–M* diagram and a careful selection on Hubble type.
5.5. Are we missing central rings
With our method we will miss central rings that have sizes close to or below our resolution limit of ∼1″ ≲ 100 pc, as well as rings that cannot be well distinguished from potential nuclear CO emission; hence, they appear as central gas disks without a notable depression inside them. Furthermore, our visual identifications requires rings having a reasonably smooth CO geometry.
AINUR (Comerón et al. 2010) found that about 8% of their identified rings have sizes below 100 pc, which is below our detection limit. A comparison to the lower resolution survey ARRAKIS (with 2″ resolution compared to 0.1″ resolution; Comerón et al. 2014) shows that 56% of these rings are no longer detected. Our non-identification of the central ring in NGC 4826 is due to this resolution limit. Having a radius of 150 pc in AINUR, we only see a central molecular disk with a pronounced southern rim, which might turn out as a full ring with higher-resolution data.
In summary, given our bias against preferentially small (r ≲ 100 pc) central rings, there could be up to another 11 rings present that appear only as central disks in the PHANGS-ALMA sample studied here. As the distributions of ring properties (Fig. 4) are biased to larger central rings, we speculate that they might extend to lower values of rring,  , and SFRring for a population of smaller rings. Being a small and not very massive ring compared to the current ring sample, the MW CMZ might turn out to sit well within all those property distributions in this case.
6. Summary and conclusion
To study the properties and possible funneling mechanisms of molecular central rings in nearby galaxies, we investigated 81 nearby main sequence galaxies from the PHANGS-ALMA survey15 and identified 20 central rings in their molecular gas distribution. We utilized 1″(≲100 pc at a distance of ≲20 Mpc) images of CO(2-1) emission tracing the bulk of the molecular gas distribution (Leroy et al. 2021b) in these 20 rings, as well as MUSE observations tracing SFR surface density ΣSFR (Belfiore et al. 2023) in 14 of these rings. To study the sizes and molecular gas content in the rings, we visually determined elliptical annular masks based on the molecular gas distribution of the galaxies. We integrated the ring CO luminosity and converted it into the ring molecular gas mass. Similarly, we integrated the central ring’s ΣSFR to estimate their SFR. Our main results are as follows.
-
Molecular gas is an excellent tracer for identifying central rings. We find a similar ring fraction of 25 ± 4 % as previous studies using different tracers (UV, optical, NIR). The ring size distribution (both absolute and relative to the disk radius) is similar to that reported by AINUR (Comerón et al. 2010).
-
Molecular central rings in nearby galaxies span a radius range (25th-75th percentile) of ∼250 − 650 pc, they contain typical molecular gas masses of ∼107.87 − 108.27 M⊙, corresponding to typical fractions of ∼3.5 − 10.1 % of their host galaxies’ molecular gas reservoir. They also have typical SFRs of ∼0.05 − 0.36 M⊙/yr, corresponding to fractions of ∼8 − 23 % of their host galaxies’ SFR. Central rings have typical depletion times of ∼0.44 − 0.76 Gyr, which is a factor ∼2 − 4 lower than typical depletion times seen in galactic disks. Thus, (most) central rings form stars more efficiently than the surrounding disks.
-
The MW CMZ appears smaller and less massive than PHANGS central rings in spiral galaxies; however, this might be due to an observational bias to larger rings in the PHANGS sample. Comparing the MW CMZ’s molecular gas and SFR fraction (relative to the total MW values) and its depletion time with PHANGS central rings, there does not appear to be a special central ring. This indicates that star formation would be expected to proceed similarly across central rings in nearby galaxies.
-
Central rings have a strong preference for barred galaxies (17/20 rings reside in clearly barred galaxies). Furthermore, longer bars contain more massive central rings, with a moderate correlation also between the relative bar length and the central ring molecular gas fraction
 . This correlation hints at the bar length being important for the process of ring fueling, although we cannot resolve this highly dynamic process with the data at hand.
 -
Central rings appear (almost) only in high-mass galaxies (log(M*/M⊙) > 10), which is in accordance with earlier observations and simulations (Comerón et al. 2010 with mass measurements from Leroy et al. 2019; Fraser-McKelvie et al. 2020; Verwilghen et al. 2024). Furthermore, ring molecular gas masses are correlated with the offset from the SFMS. However, this trend needs a more careful investigation, as all galaxies, which host central rings and are substantially below the main sequence, are ETGs, which exhibit a different gas dynamics and star-formation (efficiency).
-
We cannot confirm the notion of strong bars funneling gas more efficiently to the center, as the typical bar strength parameters (Qb, εbar and A2max) show no correlation with the ring molecular gas fraction.
We conclude that central rings are small structures that preferentially reside in the centers of barred galaxies and that they resemble the MW CMZ in many aspects. Having high molecular gas and SFR content, they appear to be extreme locations for star formation. In the future, it will be interesting to investigate their star formation processes in more detail, using a multiwavelength approach with data available as part of the still expanding PHANGS survey.
Acknowledgments
This work was carried out as part of the PHANGS collaboration. S.K.S is supported by a International Research Fellowship of Japan Society for the Promotion of Science (JSPS). MQ acknowledges support from the Spanish grant PID2022-138560NB-I00, funded by MCIN/AEI/10.13039/501100011033/FEDER, EU. RSK acknowledges financial support from the ERC via Synergy Grant “ECOGAL” (project ID 855130), from the German Excellence Strategy via the Heidelberg Cluster “STRUCTURES” (EXC 2181 - 390900948), and from the German Ministry for Economic Affairs and Climate Action in project “MAINN” (funding ID 50OO2206). RSK also thanks the 2024/25 Class of Radcliffe Fellows for highly interesting and stimulating discussions. HAP acknowledges support from the National Science and Technology Council of Taiwan under grant 113-2112-M-032 -014 -MY3. MCS acknowledges financial support from the European Research Council under the ERC Starting Grant “GalFlow” (grant 101116226) and from Fondazione Cariplo under the grant ERC attrattività n. 2023-3014. This paper makes use of the following ALMA data: ADS/JAO.ALMA#2013.1.01161.S, ADS/JAO.ALMA#2015.1.00121.S, ADS/JAO.ALMA#2015.1.00925.S, ADS/JAO.ALMA#2015.1.00956.S, ADS/JAO.ALMA#2016.1.00386.S, ADS/JAO.ALMA#2017.1.00392.S, ADS/JAO.ALMA#2017.1.00886.L, ADS/JAO.ALMA#2018.1.01651.S. ALMA is a partnership of ESO (representing its member states), NSF (USA) and NINS (Japan), together with NRC (Canada), MOST and ASIAA (Taiwan), and KASI (Republic of Korea), in cooperation with the Republic of Chile. The Joint ALMA Observatory is operated by ESO, AUI/NRAO and NAOJ. Based on observations collected at the European Southern Observatory under ESO programmes 094.C-0623 (PI: Kreckel), 095.C-0473, 098.C-0484 (PI: Blanc), 1100.B-0651 (PHANGS-MUSE; PI: Schinnerer), as well as 094.B-0321 (MAGNUM; PI: Marconi), 099.B-0242, 0100.B-0116, 098.B-0551 (MAD; PI: Carollo) and 097.B-0640 (TIMER; PI: Gadotti).
References
- Accurso, G., Saintonge, A., Catinella, B., et al. 2017, MNRAS, 470, 4750 [NASA ADS] [Google Scholar]
- Anand, G. S., Lee, J. C., Van Dyk, S. D., et al. 2021, MNRAS, 501, 3621 [Google Scholar]
- Armillotta, L., Krumholz, M. R., Di Teodoro, E. M., & McClure-Griffiths, N. M. 2019, MNRAS, 490, 4401 [NASA ADS] [CrossRef] [Google Scholar]
- Athanassoula, E. 1992, MNRAS, 259, 328 [NASA ADS] [CrossRef] [Google Scholar]
- Athanassoula, E. 1992, MNRAS, 259, 345 [Google Scholar]
- Barnes, A. T., Longmore, S. N., Battersby, C., et al. 2017, MNRAS, 469, 2263 [Google Scholar]
- Battersby, C., Walker, D. L., Barnes, A., et al. 2025a, ApJ, 984, 156 [Google Scholar]
- Battersby, C., Walker, D. L., Barnes, A., et al. 2025b, ApJ, 984, 157 [Google Scholar]
- Belfiore, F., Leroy, A. K., Sun, J., et al. 2023, A&A, 670, A67 [NASA ADS] [CrossRef] [EDP Sciences] [Google Scholar]
- Binney, J., & Tremaine, S. 2008, Galactic Dynamics, 2nd edn. (Princeton: Princeton University Press) [Google Scholar]
- Bolatto, A. D., Wolfire, M., & Leroy, A. K. 2013, ARA&A, 51, 207 [CrossRef] [Google Scholar]
- Brinchmann, J., Charlot, S., White, S. D. M., et al. 2004, MNRAS, 351, 1151 [Google Scholar]
- Burbidge, E. M., & Burbidge, G. R. 1962, ApJ, 135, 694 [Google Scholar]
- Buta, R. 1983, Bull. Am. Astron. Soc., 15, 659 [Google Scholar]
- Buta, R. 1988, ApJS, 66, 233 [Google Scholar]
- Buta, R., & Combes, F. 1996, Fund. Cosmic Phys., 17, 95 [Google Scholar]
- Buta, R., & Crocker, D. A. 1993, AJ, 105, 1344 [NASA ADS] [CrossRef] [Google Scholar]
- Callanan, D., Longmore, S. N., Kruijssen, J. M. D., et al. 2021, MNRAS, 505, 4310 [NASA ADS] [CrossRef] [Google Scholar]
- Calzetti, D., Kennicutt, R. C., Engelbracht, C. W., et al. 2007, ApJ, 666, 870 [Google Scholar]
- Carollo, C. M., Stiavelli, M., Seigar, M., de Zeeuw, P. T., & Dejonghe, H. 2002, AJ, 123, 159 [NASA ADS] [CrossRef] [Google Scholar]
- Chiang, I.-D., Sandstrom, K. M., Chastenet, J., et al. 2024, ApJ, 964, 18 [NASA ADS] [CrossRef] [Google Scholar]
- Chomiuk, L., & Povich, M. S. 2011, AJ, 142, 197 [Google Scholar]
- Combes, F. 1988, ASI Ser. C, 232, 475 [Google Scholar]
- Combes, F. 1996, ASP Conf. Ser., 91, 286 [NASA ADS] [Google Scholar]
- Comerón, S., Knapen, J. H., Beckman, J. E., et al. 2010, MNRAS, 402, 2462 [Google Scholar]
- Comerón, S., Salo, H., Laurikainen, E., et al. 2014, A&A, 562, A121 [Google Scholar]
- Contopoulos, G., & Papayannopoulos, T. 1980, A&A, 92, 33 [NASA ADS] [Google Scholar]
- Crocker, A. F., Bureau, M., Young, L. M., & Combes, F. 2011, MNRAS, 410, 1197 [NASA ADS] [CrossRef] [Google Scholar]
- Davis, T. A., Alatalo, K., Bureau, M., et al. 2013, MNRAS, 429, 534 [Google Scholar]
- Davis, T. A., Gensior, J., Bureau, M., et al. 2022, MNRAS, 512, 1522 [CrossRef] [Google Scholar]
- de Sá-Freitas, C., Gadotti, D. A., Fragkoudi, F., et al. 2025, A&A, 698, A5 [NASA ADS] [CrossRef] [EDP Sciences] [Google Scholar]
- de Vaucouleurs, G., de Vaucouleurs, A., Corwin, Jr., H. G., et al. 1991, Third Reference Catalogue of Bright Galaxies [Google Scholar]
- den Brok, J. S., Chatzigiannakis, D., Bigiel, F., et al. 2021, MNRAS, 504, 3221 [NASA ADS] [CrossRef] [Google Scholar]
- Díaz, R., Carranza, G., Dottori, H., & Goldes, G. 1999, ApJ, 512, 623 [Google Scholar]
- Díaz-García, S., Salo, H., Laurikainen, E., & Herrera-Endoqui, M. 2016, A&A, 587, A160 [NASA ADS] [CrossRef] [EDP Sciences] [Google Scholar]
- Elmegreen, D. M., Chromey, F. R., Sawyer, J. E., & Reinfeld, E. L. 1999, AJ, 118, 777 [Google Scholar]
- Emsellem, E., Schinnerer, E., Santoro, F., et al. 2022, A&A, 659, A191 [NASA ADS] [CrossRef] [EDP Sciences] [Google Scholar]
- Erwin, P. 2019, MNRAS, 489, 3553 [NASA ADS] [CrossRef] [Google Scholar]
- Erwin, P. 2024, MNRAS, 528, 3613 [Google Scholar]
- Erwin, P., & Sparke, L. S. 2002, AJ, 124, 65 [Google Scholar]
- Fraser-McKelvie, A., Aragón-Salamanca, A., Merrifield, M., et al. 2020, MNRAS, 495, 4158 [Google Scholar]
- Gao, Y., & Solomon, P. M. 2004, ApJ, 606, 271 [NASA ADS] [CrossRef] [Google Scholar]
- García-Burillo, S., Combes, F., Eckart, A., et al. 2003, ASP Conf. Ser., 290, 423 [Google Scholar]
- García-Burillo, S., Combes, F., Schinnerer, E., Boone, F., & Hunt, L. K. 2005, A&A, 441, 1011 [NASA ADS] [CrossRef] [EDP Sciences] [Google Scholar]
- Gong, M., Ostriker, E. C., Kim, C.-G., & Kim, J.-G. 2020, ApJ, 903, 142 [CrossRef] [Google Scholar]
- Henshaw, J. D., Barnes, A. T., Battersby, C., et al. 2023, ASP Conf. Ser., 534, 83 [NASA ADS] [Google Scholar]
- Henshaw, J. D., Longmore, S. N., & Kruijssen, J. M. D. 2016a, MNRAS, 463, L122 [NASA ADS] [CrossRef] [Google Scholar]
- Henshaw, J. D., Longmore, S. N., Kruijssen, J. M. D., et al. 2016b, MNRAS, 457, 2675 [Google Scholar]
- Herrera-Endoqui, M., Díaz-García, S., Laurikainen, E., & Salo, H. 2015, A&A, 582, A86 [NASA ADS] [CrossRef] [EDP Sciences] [Google Scholar]
- Hu, C.-Y., Schruba, A., Sternberg, A., & van Dishoeck, E. F. 2022, ApJ, 931, 28 [NASA ADS] [CrossRef] [Google Scholar]
- Jiménez-Sánchez, P., Comerón, S., Prieto, A., & Knapen, J. H. 2025, A&A, 700, A101 [NASA ADS] [CrossRef] [EDP Sciences] [Google Scholar]
- Kauffmann, J., Pillai, T., & Goldsmith, P. F. 2013, ApJ, 779, 185 [NASA ADS] [CrossRef] [Google Scholar]
- Kim, W.-T., Seo, W.-Y., Stone, J. M., Yoon, D., & Teuben, P. J. 2012, ApJ, 747, 60 [Google Scholar]
- Knapen, J. H. 2005, A&A, 429, 141 [NASA ADS] [CrossRef] [EDP Sciences] [Google Scholar]
- Kormendy, J., & Kennicutt, R. C. 2004, ARA&A, 42, 603 [Google Scholar]
- Kroupa, P. 2001, MNRAS, 322, 231 [NASA ADS] [CrossRef] [Google Scholar]
- Kruijssen, J. M. D., Longmore, S. N., Elmegreen, B. G., et al. 2014, MNRAS, 440, 3370 [Google Scholar]
- Kruijssen, J. M. D., Dale, J. E., & Longmore, S. N. 2015, MNRAS, 447, 1059 [Google Scholar]
- Krumholz, M. R., & Kruijssen, J. M. D. 2015, MNRAS, 453, 739 [Google Scholar]
- Lang, P., Meidt, S. E., Rosolowsky, E., et al. 2020, ApJ, 897, 122 [CrossRef] [Google Scholar]
- Laurikainen, E., & Salo, H. 2002, MNRAS, 337, 1118 [Google Scholar]
- Leaman, R., Fragkoudi, F., Querejeta, M., et al. 2019, MNRAS, 488, 3904 [NASA ADS] [CrossRef] [Google Scholar]
- Lee, J. C., Sandstrom, K. M., Leroy, A. K., et al. 2023, ApJ, 944, L17 [NASA ADS] [CrossRef] [Google Scholar]
- Leitherer, C., Schaerer, D., Goldader, J. D., et al. 1999, ApJS, 123, 3 [Google Scholar]
- Leroy, A. K., Sandstrom, K. M., Lang, D., et al. 2019, ApJS, 244, 24 [Google Scholar]
- Leroy, A. K., Hughes, A., Liu, D., et al. 2021a, ApJS, 255, 19 [NASA ADS] [CrossRef] [Google Scholar]
- Leroy, A. K., Schinnerer, E., Hughes, A., et al. 2021b, ApJS, 257, 43 [NASA ADS] [CrossRef] [Google Scholar]
- Leroy, A. K., Rosolowsky, E., Usero, A., et al. 2022, ApJ, 927, 149 [NASA ADS] [CrossRef] [Google Scholar]
- Leroy, A. K., Sun, J., Meidt, S., et al. 2025, ApJ, 985, 14 [Google Scholar]
- Levy, R. C., Bolatto, A. D., Leroy, A. K., et al. 2022, ApJ, 935, 19 [NASA ADS] [CrossRef] [Google Scholar]
- Li, Z., Shen, J., & Kim, W.-T. 2015, ApJ, 806, 150 [NASA ADS] [CrossRef] [Google Scholar]
- Lipman, D., Battersby, C., Walker, D. L., et al. 2025, ApJ, 984, 159 [Google Scholar]
- Liu, L., Bureau, M., Blitz, L., et al. 2021, MNRAS, 505, 4048 [NASA ADS] [CrossRef] [Google Scholar]
- Łokas, E. L., Athanassoula, E., Debattista, V. P., et al. 2014, MNRAS, 445, 1339 [Google Scholar]
- Łokas, E. L., Ebrová, I., del Pino, A., et al. 2016, ApJ, 826, 227 [Google Scholar]
- Longmore, S. N., Bally, J., Testi, L., et al. 2013, MNRAS, 429, 987 [NASA ADS] [CrossRef] [Google Scholar]
- Makarov, D., Prugniel, P., Terekhova, N., Courtois, H., & Vauglin, I. 2014, A&A, 570, A13 [NASA ADS] [CrossRef] [EDP Sciences] [Google Scholar]
- Maoz, D., Barth, A. J., Sternberg, A., et al. 1996, AJ, 111, 2248 [Google Scholar]
- Martini, P., Regan, M. W., Mulchaey, J. S., & Pogge, R. W. 2003, ApJS, 146, 353 [NASA ADS] [CrossRef] [Google Scholar]
- Meidt, S. E., Leroy, A. K., Rosolowsky, E., et al. 2018, ApJ, 854, 100 [NASA ADS] [CrossRef] [Google Scholar]
- Mills, E. A. C. 2017, ArXiv e-prints [arXiv:1705.05332] [Google Scholar]
- Molinari, S., Bally, J., Noriega-Crespo, A., et al. 2011, ApJ, 735, L33 [Google Scholar]
- Möllenhoff, C., & Heidt, J. 2001, A&A, 368, 16 [NASA ADS] [CrossRef] [EDP Sciences] [Google Scholar]
- Moon, S., Kim, W.-T., Kim, C.-G., & Ostriker, E. C. 2021, ApJ, 914, 9 [Google Scholar]
- Moon, S., Kim, W.-T., Kim, C.-G., & Ostriker, E. C. 2023, ApJ, 946, 114 [NASA ADS] [CrossRef] [Google Scholar]
- Nguyen, D. D., & Thompson, T. A. 2022, ApJ, 935, L24 [NASA ADS] [CrossRef] [Google Scholar]
- Noeske, K. G., Weiner, B. J., Faber, S. M., et al. 2007, ApJ, 660, L43 [CrossRef] [Google Scholar]
- Noguchi, M. 1987, MNRAS, 228, 635 [NASA ADS] [Google Scholar]
- Pogge, R. W. 1989, ApJS, 71, 433 [Google Scholar]
- Pogge, R. W., & Martini, P. 2002, ApJ, 569, 624 [CrossRef] [Google Scholar]
- Prugniel, P., Nieto, J. L., & Simien, F. 1987, A&A, 173, 49 [Google Scholar]
- Querejeta, M., Meidt, S. E., Schinnerer, E., et al. 2016, A&A, 588, A33 [NASA ADS] [CrossRef] [EDP Sciences] [Google Scholar]
- Querejeta, M., Schinnerer, E., Meidt, S., et al. 2021, A&A, 656, A133 [NASA ADS] [CrossRef] [EDP Sciences] [Google Scholar]
- Roman-Duval, J., Heyer, M., Brunt, C. M., et al. 2016, ApJ, 818, 144 [NASA ADS] [CrossRef] [Google Scholar]
- Ruiz-García, M., Querejeta, M., García-Burillo, S., et al. 2024, A&A, 691, A351 [NASA ADS] [CrossRef] [EDP Sciences] [Google Scholar]
- Sakamoto, K., Okumura, S. K., Ishizuki, S., & Scoville, N. Z. 1999a, ApJ, 525, 691 [NASA ADS] [CrossRef] [Google Scholar]
- Sakamoto, K., Okumura, S. K., Ishizuki, S., & Scoville, N. Z. 1999b, ApJS, 124, 403 [NASA ADS] [CrossRef] [Google Scholar]
- Salo, H., Laurikainen, E., Laine, J., et al. 2015, ApJS, 219, 4 [Google Scholar]
- Sandqvist, A., Joersaeter, S., & Lindblad, P. O. 1995, A&A, 295, 585 [NASA ADS] [Google Scholar]
- Schinnerer, E., & Leroy, A. K. 2024, ARA&A, 62, 369 [NASA ADS] [CrossRef] [Google Scholar]
- Schinnerer, E., Emsellem, E., Henshaw, J. D., et al. 2023, ApJ, 944, L15 [NASA ADS] [CrossRef] [Google Scholar]
- Schwarz, M. P. 1981, ApJ, 247, 77 [NASA ADS] [CrossRef] [Google Scholar]
- Schwarz, M. P. 1984, MNRAS, 209, 93 [NASA ADS] [CrossRef] [Google Scholar]
- Sellwood, J. A., & Wilkinson, A. 1993, Rep. Progr. Phys., 56, 173 [CrossRef] [Google Scholar]
- Seo, W.-Y., & Kim, W.-T. 2013, ApJ, 769, 100 [NASA ADS] [CrossRef] [Google Scholar]
- Sérsic, J. L., & Pastoriza, M. 1965, PASP, 77, 287 [CrossRef] [Google Scholar]
- Sheth, K., Vogel, S. N., Regan, M. W., Thornley, M. D., & Teuben, P. J. 2005, ApJ, 632, 217 [NASA ADS] [CrossRef] [Google Scholar]
- Sormani, M. C., & Barnes, A. T. 2019, MNRAS, 484, 1213 [NASA ADS] [CrossRef] [Google Scholar]
- Sormani, M. C., Binney, J., & Magorrian, J. 2015, MNRAS, 449, 2421 [NASA ADS] [CrossRef] [Google Scholar]
- Sormani, M. C., Sobacchi, E., & Sanders, J. L. 2024, MNRAS, 528, 5742 [CrossRef] [Google Scholar]
- Stuber, S. K., Schinnerer, E., Williams, T. G., et al. 2023, A&A, 676, A113 [NASA ADS] [CrossRef] [EDP Sciences] [Google Scholar]
- Sun, J., Leroy, A. K., Ostriker, E. C., et al. 2020, ApJ, 892, 148 [NASA ADS] [CrossRef] [Google Scholar]
- Sun, J., Leroy, A. K., Rosolowsky, E., et al. 2022, AJ, 164, 43 [NASA ADS] [CrossRef] [Google Scholar]
- Sun, J., He, H., Batschkun, K., et al. 2024, ApJ, 967, 133 [NASA ADS] [CrossRef] [Google Scholar]
- Sun, J., Teng, Y.-H., Chiang, I.-D., et al. 2025, ApJ, 994, 263 [Google Scholar]
- Tacchella, S., Dekel, A., Carollo, C. M., et al. 2016, MNRAS, 457, 2790 [Google Scholar]
- Teng, Y.-H., Chiang, I.-D., Sandstrom, K. M., et al. 2024, ApJ, 961, 42 [NASA ADS] [CrossRef] [Google Scholar]
- Teng, Y.-H., Sandstrom, K. M., Sun, J., et al. 2023, ApJ, 950, 119 [NASA ADS] [CrossRef] [Google Scholar]
- Veilleux, S., Maiolino, R., Bolatto, A. D., & Aalto, S. 2020, A&ARv, 28, 2 [NASA ADS] [CrossRef] [Google Scholar]
- Verwilghen, P., Emsellem, E., Renaud, F., et al. 2024, A&A, 687, A53 [NASA ADS] [CrossRef] [EDP Sciences] [Google Scholar]
- Verwilghen, P., Emsellem, E., Renaud, F., et al. 2025, A&A, 700, A3 [NASA ADS] [CrossRef] [EDP Sciences] [Google Scholar]
- Walker, D. L., Battersby, C., Lipman, D., et al. 2025, ApJ, 984, 158 [Google Scholar]
- Williams, T. G., Belfiore, F., Bureau, M., et al. 2025, MNRAS, 538, 3219 [Google Scholar]
Central rings are also often referred to as nuclear or circumnuclear rings, but we use the term central rings as the formation of such rings is thought to be linked to larger global features such as bars, rather than to nuclear activity.
This family of orbits lie at or within the ILR, if one is present – not all barred galaxies show an ILR; see, e.g., Athanassoula (1992). If two ILRs are present, the x2-orbits lie between them (e.g. Athanassoula 1992; Buta & Combes 1996).
Values obtained from Henshaw et al. (2023), Mills (2017), or calculated with global MW values from Chomiuk & Povich (2011), Roman-Duval et al. (2016).
Note: the bar classification of NGC 2997 remains ambiguous; see Appendix A.
Where the uncertainty is dominated by our view through the galactic disk.
Because we need to resolve substructure within the ring to identify it as such; see criterion (b) in Sect. 3.1.
AINUR uses the relative ring diameter Dring/D0, reporting that D0 is close to D25 (Comerón et al. 2010), so rring/r25 ≈ Dring/D0 for most of the galaxies.
NGC 4476’s central ring is also an outlier in the molecular gas fraction, where it contains 60% of its host galaxy’s molecular gas.
Note: the Pearson correlation coefficients are calculated for the quantities themselves (not their logarithms) unless stated otherwise. Errors on p values are calculated by resampling the data 1000 times within their error bars and taking the standard deviation of the resulting p value distribution.
As all bar strength parameters are relative parameters, either giving the relative torque (Qb), or the contrast between bar and the surrounding (A2max, εbar), we tested for correlations with the relative gas content.
With the exception of NGC 4476, which is also an outlier in the ring molecular gas fraction.
Which have sufficiently high resolution data available.
Carollo et al. (2002) do not provide a size of this nuclear star-forming spiral which we could directly compare with our central ring measurement. As we do not see any spiral feature in CO(2-1) emission, we think the features are actually the same, but may look different in the respective tracers.
Appendix A: Central ring sample: Comments on individual rings
In the following, we comment on the morphology of the central rings and their host galaxies identified in this work. We adopted the morphology of the host galaxies from the Third Reference Catalogue of Bright Galaxies (RC3, de Vaucouleurs et al. 1991). We list the original reference for each central ring, where it has been first reported, following Comerón et al. (2010) for those rings included both in their work and this study.
-
NGC 1097 Barred spiral galaxy, central ring first detected by Burbidge & Burbidge (1962) in Hα. Buta & Crocker (1993), however, claim that the ring is a pseudo-ring. Following AINUR (Comerón et al. 2010), we regard the ring as a typical central ring: It appears as an almost perfect closed ring in the molecular gas distribution, distinct from an emission component in the very center.
-
NGC 1300 Barred spiral galaxy, central ring first mentioned by Pogge (1989), who detected it in Hα. Closed, but asymmetric ring, its northern part is brighter than the southern one.
-
NGC 1365 Barred spiral galaxy, central ring reported by, e.g., Sandqvist et al. (1995), observing it in the radio continuum. Furthermore, Schinnerer et al. (2023) studied the molecular gas dynamics of this specific ring in detail (resolution of ∼0.3″ ≃ 30 pc). Rather elliptical (both in projection and deprojection) ring that is brighter in CO along the northeastern rim.
-
NGC 1433 Barred spiral galaxy, central ring first reported as ring of concentrated H II regions by Buta (1983). It shows a lot of emission within the central ring, which makes it difficult to determine a clear ring shape. Therefore, AINUR (Comerón et al. 2010) reports a ring of roughly half the size found in this study. CO emission along the ring appears irregular and clumpy, but the ring is almost completely closed.
-
NGC 1512 Barred spiral galaxy, central ring first detected by Buta (1988) in Hα. The CO ring is very bright at the connection points with the bar lanes and fainter in between, but it is completely closed and very distinct from a nuclear emission component.
-
NGC 1566 Weakly barred spiral galaxy, central ring first directly detected “as a dusty feature in the color-index map” by Comerón et al. (2010). The molecular ring is made up of a few diffuse features that do not connect to form a full ring. Dusty features seen by JWST at 7.7 μm (Lee et al. 2023), however, clearly show a full ring.
-
NGC 1672 Barred spiral galaxy, central ring first detected as ring of H II regions by Díaz et al. (1999). Closed but asymmetric ring, the south is brighter than the north in CO emission.
-
NGC 2566 Barred spiral galaxy, central ring reported by Carollo et al. (2002) as nuclear star-forming spiral16 in optical-NIR color maps. In CO, the ring is brighter in the south and almost blurs with a central emission component.
-
NGC 2903 Barred spiral galaxy, central ring first detected by Sakamoto et al. (1999b) in CO(J = 1 → 0) emission. Diffuse molecular features around the central ring complicate defining the exact shape of the ring. Almost closed central ring, which appears very elliptical due to the high inclination of the host galaxy.
-
NGC 2997 Weakly barred spiral galaxy, central ring first detected by Sérsic & Pastoriza (1965) in the optical. The classification of this galaxy as either barred or unbarred is debated: While Comerón et al. (2010) regards NGC 2997 as unbarred, Elmegreen et al. (1999) adopt the classification in the RC3 of this galaxy as weakly barred. Instead of a bar, Comerón et al. (2010) suggest that the central ring might be induced by NGC 2997’s strong spiral arms. In the plots throughout this paper, we mark NGC 2997 as unbarred spiral. The CO emission ring has a gap in the west close to the connection point with the western spiral arm.
-
NGC 3351 Barred spiral galaxy, central ring first reported by Sérsic & Pastoriza (1965) in the optical. Almost completely closed ring in CO emission, which is distinct from an emission component in the very center.
-
NGC 3489 Weakly barred ETG, central ring reported by, e.g., Erwin & Sparke (2002), who observed it in the NIR. Given the galaxy’s high inclination it was not considered by AINUR (Comerón et al. 2010). Very elliptical ring in CO emission due to the inclination. It is roughly broken into a western and eastern half.
-
NGC 4303 Weakly barred spiral galaxy, central ring first detected by Möllenhoff & Heidt (2001) in the NIR. The brighter western part of the molecular central ring blurs with emission associated with the nucleus. Therefore, the molecular ring seems to be offset from the star formation ring which is centered at the nucleus.
-
NGC 4321 Weakly barred spiral galaxy, central ring first detected by Sérsic & Pastoriza (1965) in the optical. According to Comerón et al. (2010), this ring is a limiting case between a classical central ring and a pseudo-ring. Indeed, in CO(2-1) emission, the ring is broken into a western and eastern half, that are closely connected to the bar lanes, which we still consider as ring-like. The ring is clearly distinct from a nuclear emission component.
-
NGC 4459 ETG, containing two central rings (Comerón et al. 2010). The feature identified as central ring in this paper was first detected as “inner nuclear ring” in HST UV images by Comerón et al. (2010). They suggest that the central ring is formed by interactions with the neighboring galaxies NGC 4468 and/or NGC 4474. Very smooth and closed thick ring in CO, no central emission component.
-
NGC 4476 ETG, central ring reported by Prugniel et al. (1987) as dust ring in the optical and NUV. The central ring is the only feature seen in the molecular gas distribution of this galaxy. Completely closed ring, no nuclear emission component.
-
NGC 4477 Barred ETG, central ring reported by Crocker et al. (2011), who observed it in CO(J = 1 → 0) and CO(J = 2 → 1) emission. The completely closed central ring and the beginnings of the bar lanes are the only features seen in NGC 4477’s molecular gas distribution.
-
NGC 5236 Weakly barred spiral galaxy, central ring first detected by Buta & Crocker (1993) in the optical. Almost completely closed ring in CO with bright connection points to the bar lanes. Some diffuse features around the ring.
-
NGC 5248 Weakly barred spiral galaxy, containing two central rings. The feature identified as central ring in this paper is the “outer nuclear ring” (Comerón et al. 2010), which was first detected by Sérsic & Pastoriza (1965) in the optical. The bar lanes near the connection points with the central ring are very bright in CO(2-1) emission and might be confused as being part of the ring. Compared to the bar lanes and the nucleus, the ring is rather faint in CO and a bit clumpy.
-
NGC 7743 Barred ETG, central ring reported by Martini et al. (2003) as loosely wound nuclear spiral in the optical and NIR. The central ring and few diffuse features around it are the only features seen in NGC 7743’s molecular gas distribution. The ring is almost completely closed, but has faint spots in the north and south.
Appendix B: Central ring masks
Central ring masks.
Appendix C: Possible biases and further ring properties
In the following, we provide a set of tests for different biases and potential relations.
Subsample of rings with SFR maps: We verified that our subsample of central rings with SFR maps is representative of the whole sample. As shown in Fig. C.1, these central rings have similar distributions in (relative) radius and molecular gas mass while being slightly larger than the whole sample (550 ± 240 pc instead of  pc).
pc).
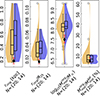 |
Fig. C.1. Same as Fig. 4 but only for r, r/r25, |


Correlations with offset from the main sequence: In Fig. C.2, we explore possible correlations between central ring properties and the location of a galaxy with respect to the main sequence. The correlations between the galaxies’ offset from the main sequence Δ MS and the central ring molecular gas mass fraction or their depletion time are ambiguous. The tentative (p = (3.7 ± 3.2)%) correlation between  and Δ MS is mostly driven by the outlier NGC 4476 and disappears if we neglect this source (then, p = (7 ± 9)%).
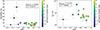 |
Fig. C.2. Central ring molecular gas fraction (left panel) and their depletion times (right panel) as function of their host galaxies’ offset from the main sequence. Symbols are the same as in Fig. 1. |
Bar strength parameters: In Fig. C.3, we include the plots showing the classical bar strength parameters A2max, Qb (Díaz-García et al. 2016) and εbar (Herrera-Endoqui et al. 2015) as functions of the central ring molecular gas fraction  . We do not find any correlation here.
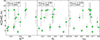 |
Fig. C.3. Central ring molecular gas fraction as function of the bar parameters A2max (bar maximum normalized m = 2 Fourier amplitude; left), Qb (bar gravitational torque parameter; middle), and εbar (bar ellipticity; right). Symbols are the same as in Fig. 1. |
All Tables
All Figures
|
Fig. 1. Global SFR as a function of global stellar mass for our sample galaxies from the PHANGS-ALMA sample. Solid and dashed black lines denote the main sequence of star-forming galaxies with a scatter of 0.36 dex, as given by Leroy et al. (2019). The PHANGS galaxies with central rings are color coded by the central ring gas mass as obtained in this study and the different symbols denote barred spiral (diamond) and unbarred spiral (open diamond) galaxies, barred early-type galaxies (ETGs, cross), and unbarred ETGs (open cross). The MW is plotted as a black dot with red errorbars. |
| In the text | |
|
Fig. 2. Molecular gas distribution of the galaxy NGC 1097. The different ellipses represent the best elliptical annulus (red, solid line) and uncertainty ellipses (black, dashed lines), indicating emission which is definitely ring material (narrower annulus: strict mask) and emission that might still be ring material (wider annulus: broad mask). The white circle in the lower left corner indicates the beam size and a scalebar is provided in the lower right. The color bar indicates the integrated intensity in terms of the brightness temperature. |
| In the text | |
|
Fig. 3. Gallery of central rings identified in a sample of 81 PHANGS-ALMA galaxies. The galaxy name is given at the top of each panel. All panels have the same physical size of 3 × 3 kpc2, but with differing color stretches. The minimum and maximum intensity is listed at the bottom right of each panel. The best elliptical annulus (see Sect. 3.2) is plotted in red and the beam size is plotted in white in the lower left corner. |
| In the text | |
|
Fig. 4. Distributions of central ring parameters (from left to right): Radius, rring, relative radius, rring/r25, molecular gas mass, |
| In the text | |
|
Fig. 5. Distribution of the absolute central ring radius (upper panel) and the ring radius relative to the disk size as measured by r25 (lower panel). The green histogram shows the sample of central rings in this study while the white histogram shows the ring sample of AINUR (Comerón et al. 2010). |
| In the text | |
|
Fig. 6. Dependence of the molecular gas mass in PHANGS central rings on the offset from the main sequence ΔMS. The symbols follow Fig. 1 (barred spiral = diamond, unbarred spiral = open diamond, barred ETGs = cross, and unbarred ETGs = open cross). Pearson correlation coefficient is listed in the top left. Data points are color-coded according to the host galaxies’ numerical Hubble Type. |
| In the text | |
|
Fig. 7. Left: dependence of the molecular gas mass in PHANGS central rings on the bar length. Data points are color-coded by their host galaxies’ stellar mass M*gal. Right: Dependence of the relative ring molecular gas content on the relative bar length, color-coded by their host galaxies’ gas fraction |
| In the text | |
|
Fig. C.1. Same as Fig. 4 but only for r, r/r25, |
| In the text | |
|
Fig. C.2. Central ring molecular gas fraction (left panel) and their depletion times (right panel) as function of their host galaxies’ offset from the main sequence. Symbols are the same as in Fig. 1. |
| In the text | |
|
Fig. C.3. Central ring molecular gas fraction as function of the bar parameters A2max (bar maximum normalized m = 2 Fourier amplitude; left), Qb (bar gravitational torque parameter; middle), and εbar (bar ellipticity; right). Symbols are the same as in Fig. 1. |
| In the text | |
Current usage metrics show cumulative count of Article Views (full-text article views including HTML views, PDF and ePub downloads, according to the available data) and Abstracts Views on Vision4Press platform.
Data correspond to usage on the plateform after 2015. The current usage metrics is available 48-96 hours after online publication and is updated daily on week days.
Initial download of the metrics may take a while.