Fig. 4.
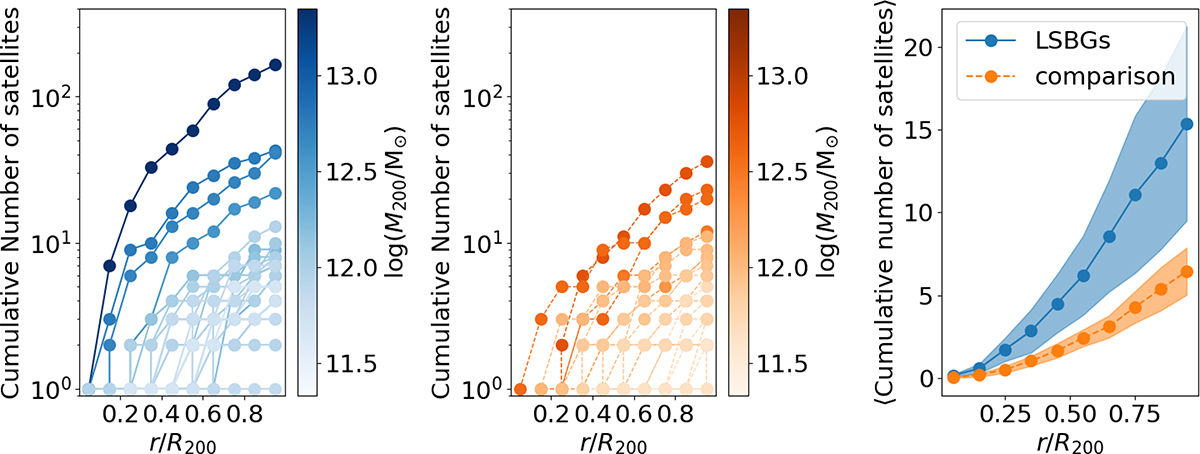
Download original image
Cumulative number of satellites as a function of the distance to the central galaxy in units of the virial radius (R200) of their host halo. Left panel: LSBG sample (blue shaded). Middle panel: Comparison sample (orange shaded). In both cases, the lines connecting dots correspond to each satellite system of a central galaxy. The colour intensity of each line indicates the mass of the host halo. Right panel: Mean number of satellites of each sample (LSBGs in blue; comparison sample in orange). The bootstrap errors of the median are indicated by the shadowed areas.
Current usage metrics show cumulative count of Article Views (full-text article views including HTML views, PDF and ePub downloads, according to the available data) and Abstracts Views on Vision4Press platform.
Data correspond to usage on the plateform after 2015. The current usage metrics is available 48-96 hours after online publication and is updated daily on week days.
Initial download of the metrics may take a while.