Fig. 5.
Download original image
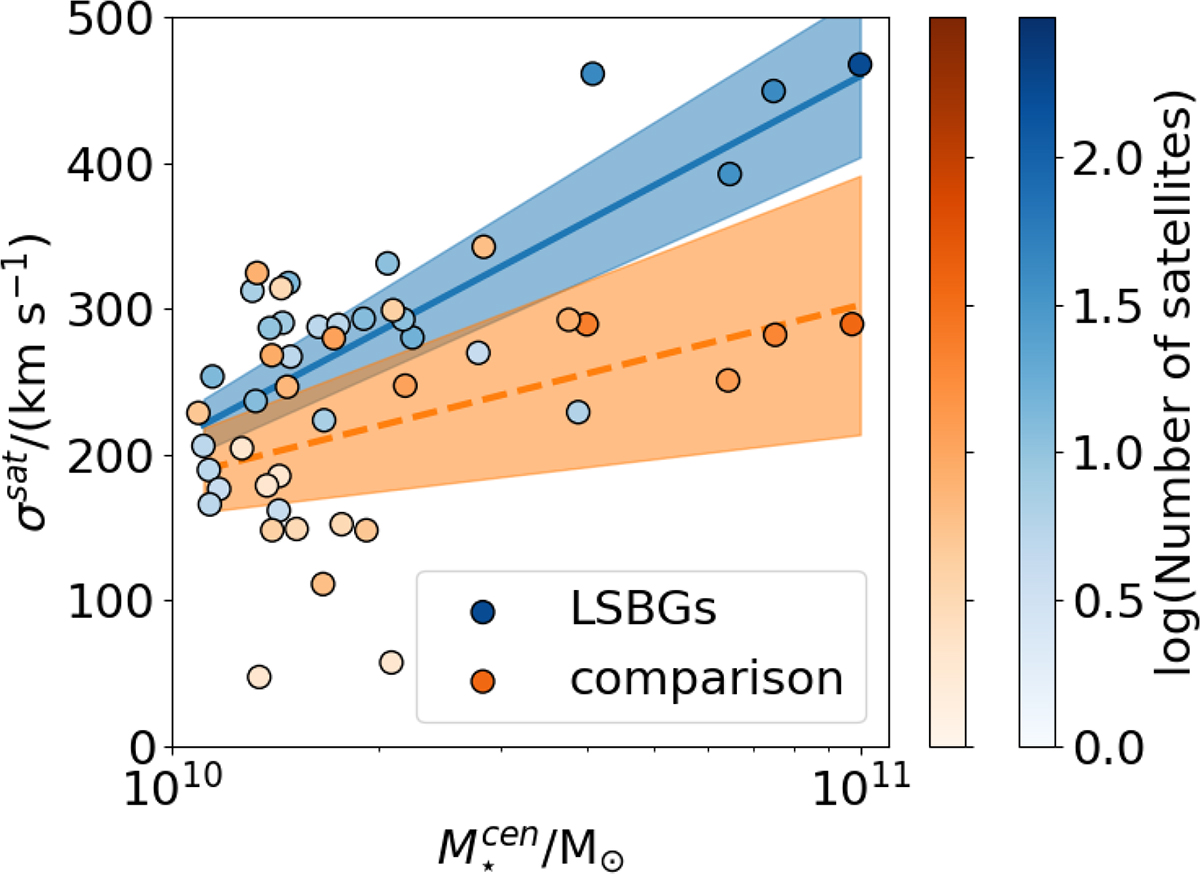
Velocity dispersion (σsat) of the satellite system of each host halo as a function of the stellar mass of the central galaxy. For each sample, the number of satellites is indicated by the shade of the coloured circle: blue circles are for the LSBG sample, and orange circles are for the comparison sample. The solid lines correspond to a linear fit, and the shadowed region indicates the fit error.
Current usage metrics show cumulative count of Article Views (full-text article views including HTML views, PDF and ePub downloads, according to the available data) and Abstracts Views on Vision4Press platform.
Data correspond to usage on the plateform after 2015. The current usage metrics is available 48-96 hours after online publication and is updated daily on week days.
Initial download of the metrics may take a while.