Open Access
Fig. 7.
Download original image
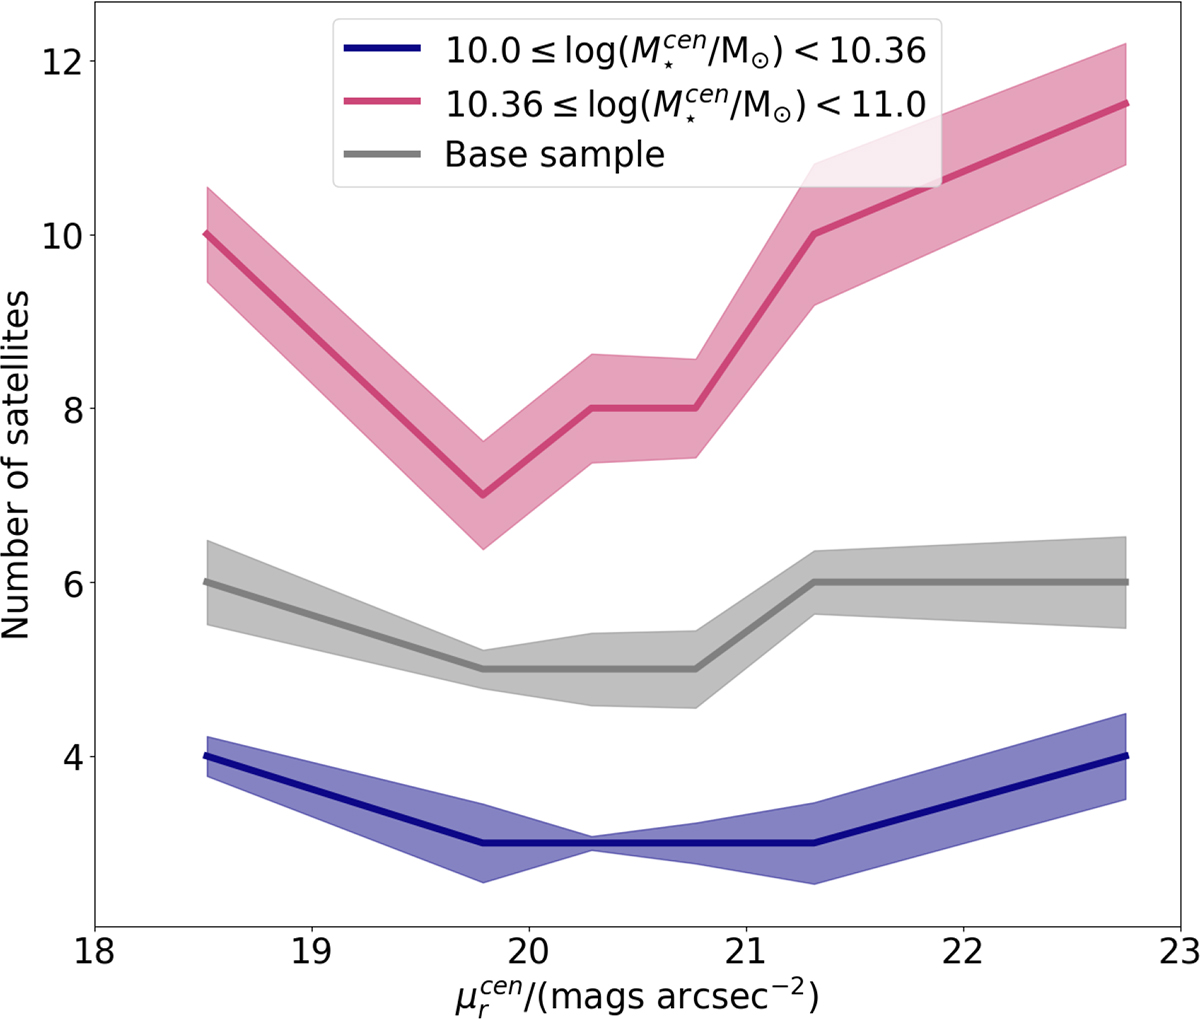
Median number of satellites as a function of the surface brightness (μrcen) for all central galaxies in the analysed mass range. The galaxies are split by stellar mass in low-mass (![]() , indigo line) and high-mass (
, indigo line) and high-mass (![]() , pink line), while the base sample is presented in grey. The shadowed areas indicate the median bootstrap error.
, pink line), while the base sample is presented in grey. The shadowed areas indicate the median bootstrap error.
Current usage metrics show cumulative count of Article Views (full-text article views including HTML views, PDF and ePub downloads, according to the available data) and Abstracts Views on Vision4Press platform.
Data correspond to usage on the plateform after 2015. The current usage metrics is available 48-96 hours after online publication and is updated daily on week days.
Initial download of the metrics may take a while.