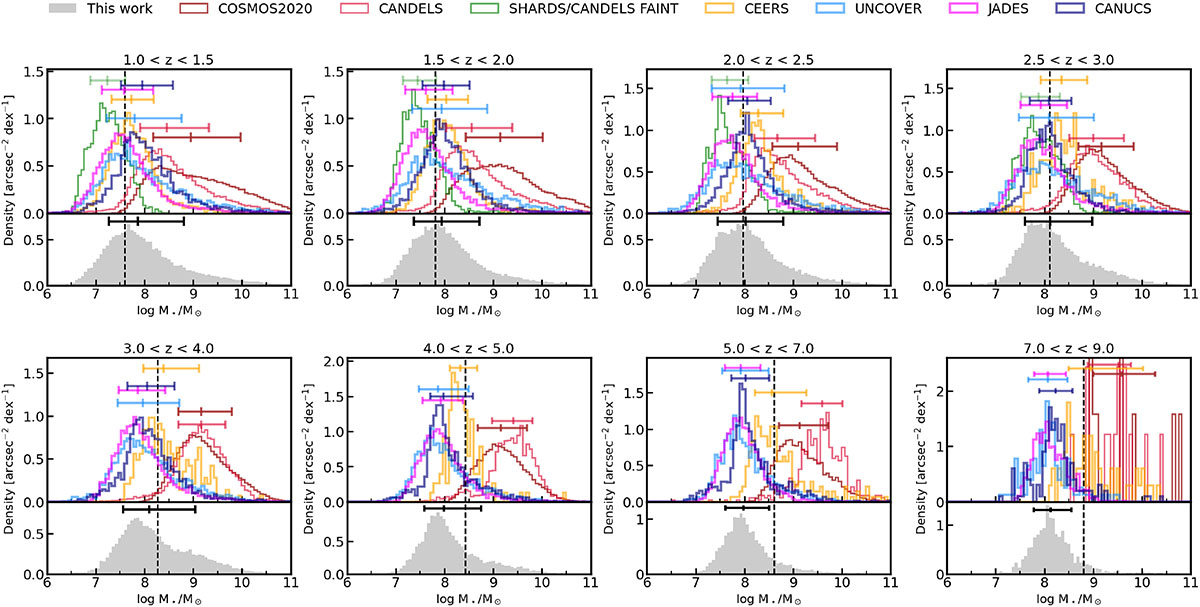
Fig. 2.
Download original image
Stellar mass histograms in different redshift intervals showing the distribution of the CANDELS (red), COSMOS2020 (maroon), SHARDS/CANDELS FAINT (green), JWST/CEERS (yellow), JADES (fuchsia), CANUCS (navy), and UNCOVER (blue) surveys. Each histogram is normalized such that the total area under the curve equals 1. The solid gray histograms in the panels underneath show the distribution of the galaxies that entered our final selection, combining the previous surveys (see Sect. 3). The 16th, 50th, and 84th percentiles for each distribution are displayed as segments, color-coded following the histograms (black for our final sample). Vertical dashed lines depict the 80% mass-completeness limit of our sample (see Sect. 3.2).
Current usage metrics show cumulative count of Article Views (full-text article views including HTML views, PDF and ePub downloads, according to the available data) and Abstracts Views on Vision4Press platform.
Data correspond to usage on the plateform after 2015. The current usage metrics is available 48-96 hours after online publication and is updated daily on week days.
Initial download of the metrics may take a while.