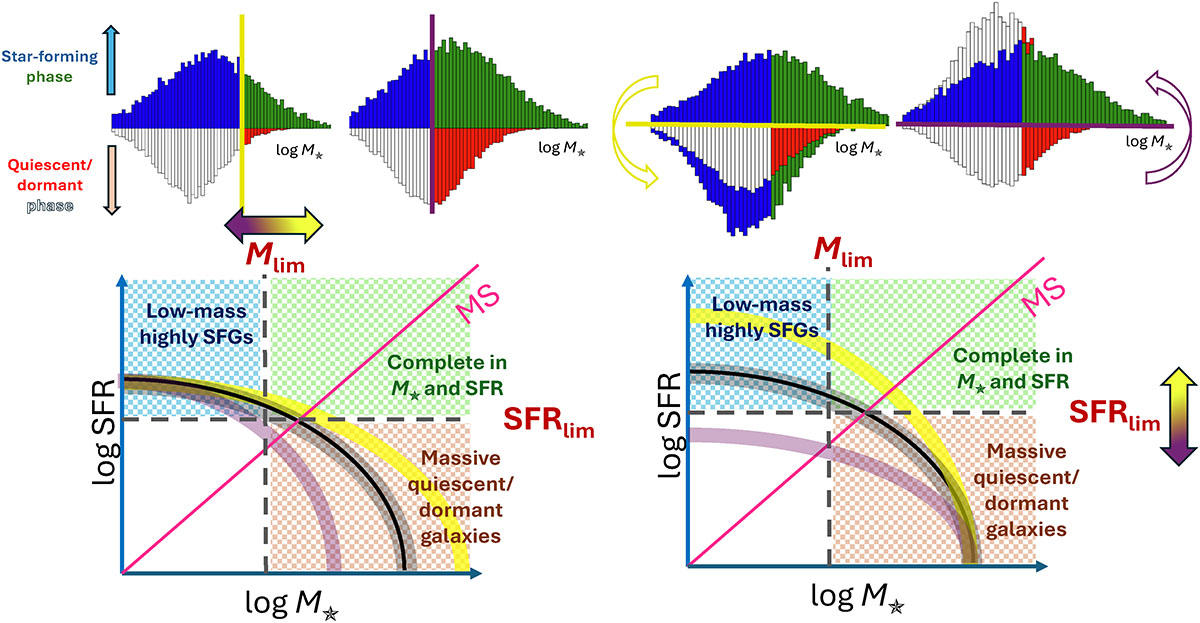
Fig. 5.
Download original image
Cartoon depicting the variations induced in the M★ (left) and SFR (right) completeness limits by changes in the shape of the completeness function (black line). We plot some hypothetical SFR and M★ limits as dashed lines. The hatched green region encloses the SFR and M★ values above both completeness limits. The hatched blue region highlights the locus of galaxies that would be detected thanks to their high SFR, but that lie below the M★ limit. The hatched orange region contains galaxies above the M★ limit that would be hard to detect because of their low SFR. The white region is occupied by galaxies that are below the M★ and SFR limits. In yellow (pink), we show how the curve should change in order to increase (decrease) both the M★ and SFR limits independently. Histograms above each panel exemplify how changes in M★ or SFR completeness would affect our final sample. Bins are color-coded according to the regions they would occupy in the log SFR−log M★ plane. We display two mirrored histograms, showing galaxies that lie above (blue and green) and below (white and red) the SFR limit. The quiescent or dormant histogram is centered at a lower M★, as bursty star formation rules at lower M★ (i.e., quiescence is not permanent and these galaxies should be included in an MS analysis). At higher M★ galaxies that fall below the MS are more prone to remain quiescent, and thus would be discarded through UVJ and sSFR cuts. Vertical and horizontal lines are color-coded following the bottom panels. The last two histograms exemplify how objects would move from the top to the mirrored histograms, and vice versa, as we change the SFR limit.
Current usage metrics show cumulative count of Article Views (full-text article views including HTML views, PDF and ePub downloads, according to the available data) and Abstracts Views on Vision4Press platform.
Data correspond to usage on the plateform after 2015. The current usage metrics is available 48-96 hours after online publication and is updated daily on week days.
Initial download of the metrics may take a while.