Fig. 6.
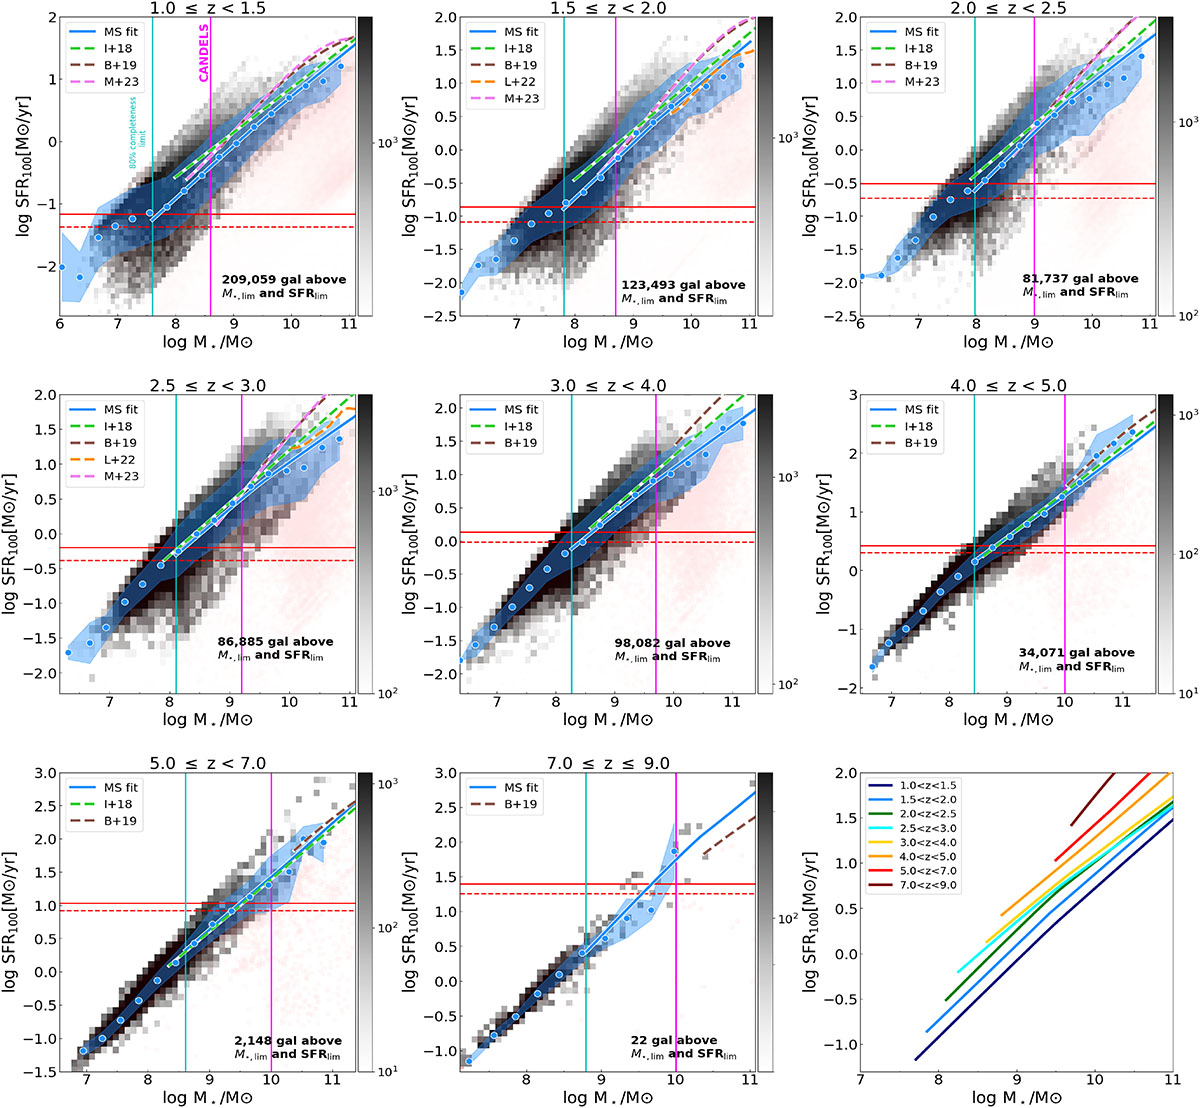
Download original image
Star formation rates versus stellar masses for our sample, divided into different redshift intervals covering 1 ≤ z ≤ 9. Galaxies are represented in gray in a 2D histogram using a symmetric logarithmic scale. In light red, we include a scatter plot (i.e., individual points) showing the galaxies that did not pass our sSFR screening. The vertical cyan lines denote the 80% mass completeness limits of our dataset. Previous limits from CANDELS are represented as vertical fuchsia lines (B+19, not corrected for outshining). The horizontal lines show our SFR limits, computed without attenuation (dashed red line) and taking the median Av of the sample in the corresponding z interval (solid red line). The LOWESS fit to the MS is shown as a thick blue line; running medians are displayed as blue circles, and the standard deviation is represented by the shaded blue region. We include four fits from the literature as dashed lines: green for Iyer et al. (2018), brown for B+19, orange for Leja et al. (2022), and pink for M+23. These fits are plotted down to their M★ completeness limits. B+19 and M+23 fits were corrected for outshining using the Sorba & Sawicki (2018) prescription. The last panel shows all our fits together, color-coded by redshift. They are displayed down to the corresponding M★ and SFR limits of the bin (see Sect. 3.2).
Current usage metrics show cumulative count of Article Views (full-text article views including HTML views, PDF and ePub downloads, according to the available data) and Abstracts Views on Vision4Press platform.
Data correspond to usage on the plateform after 2015. The current usage metrics is available 48-96 hours after online publication and is updated daily on week days.
Initial download of the metrics may take a while.