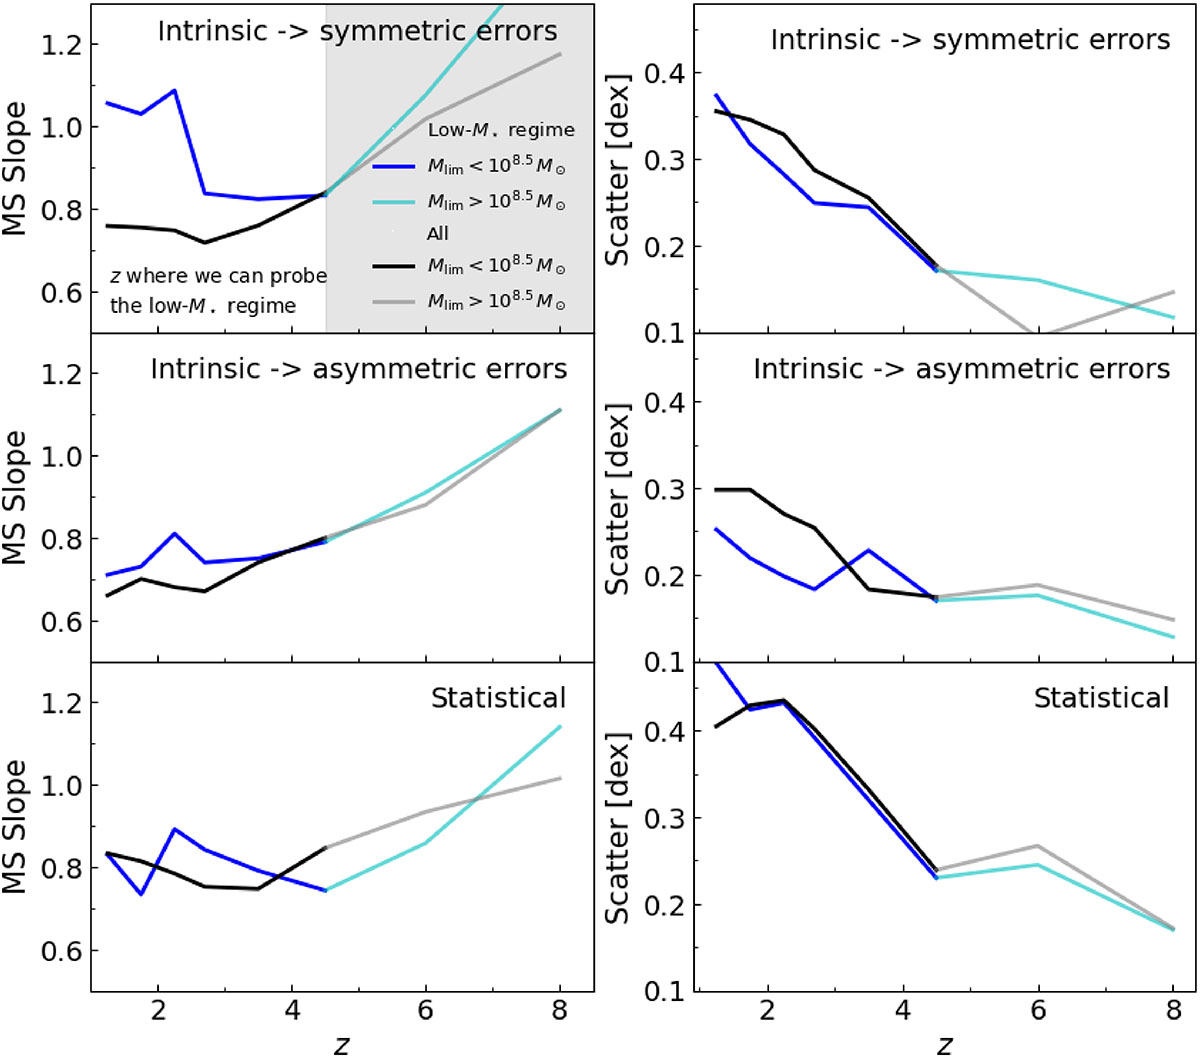
Fig. 7.
Download original image
Main sequence slope (first column) and scatter (second column) derived using the different fitting methods; namely, lmfit, assuming symmetric errors (top), emcee, considering asymmetries (middle), and scipy.optimize (bottom), fitting the data to a straight line. In each subplot, blue colors show the evolution of the parameters for the low-M★ regime (i.e., below the CANDELS M★ limits), whereas black represents our findings for the overall M★ regime. Colors are more intense up to z ∼ 5, where we have the means to explore ≲108.5 M★ objects with an SFR and mass-complete sample. At higher z, the low-M★ sample is not actually probing the physical low-M★ regime; the sample is dominated by the high-M★ end. The values here represented can be consulted in Table 3.
Current usage metrics show cumulative count of Article Views (full-text article views including HTML views, PDF and ePub downloads, according to the available data) and Abstracts Views on Vision4Press platform.
Data correspond to usage on the plateform after 2015. The current usage metrics is available 48-96 hours after online publication and is updated daily on week days.
Initial download of the metrics may take a while.