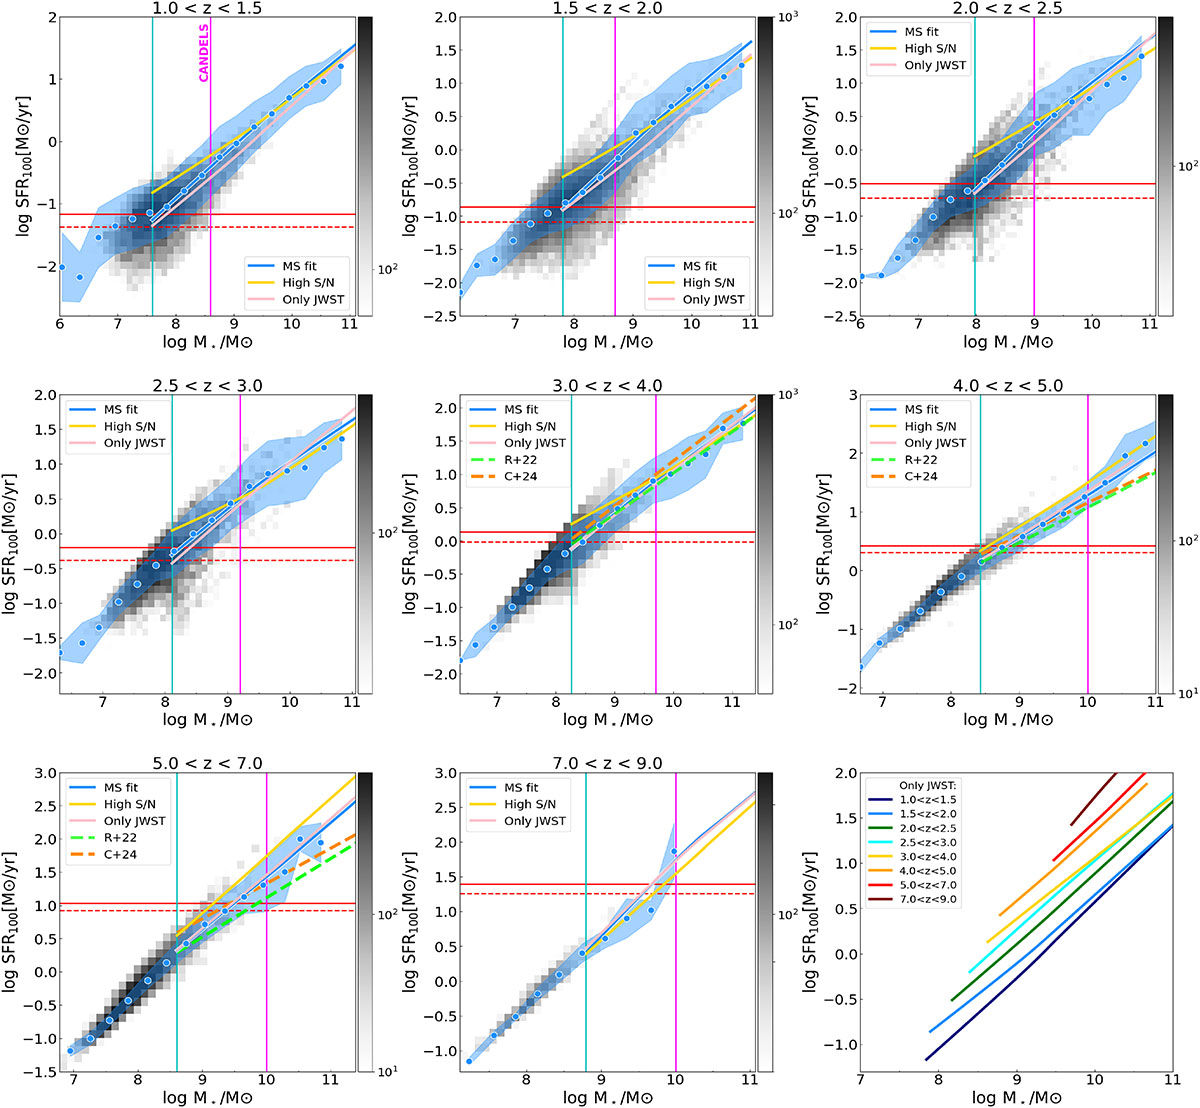
Fig. D.1.
Download original image
Star formation rates versus stellar masses divided into different redshift intervals covering 1 < z < 9. The 2D histograms represented here correspond only to the JWST data. The LOWESS fit to the main sequence described in Sect. 4 is shown in blue; in yellow, we include the MS fit using only those galaxies with S/N > 50 in at least five bands; in pink, we show the fits derived using only JWST data. We include two fits to the MS from the literature as dashed lines: lime for Rinaldi et al. 2022 and orange for Clarke et al. 2024.
Current usage metrics show cumulative count of Article Views (full-text article views including HTML views, PDF and ePub downloads, according to the available data) and Abstracts Views on Vision4Press platform.
Data correspond to usage on the plateform after 2015. The current usage metrics is available 48-96 hours after online publication and is updated daily on week days.
Initial download of the metrics may take a while.