Fig. 2
Download original image
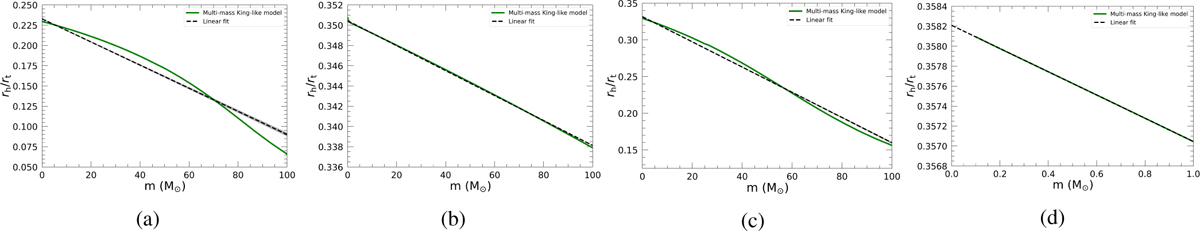
Half-mass radius normalized to tidal radius as a function of mass predicted by the model (green line) for different model parameters. The dashed black like is the linear fit through Eq. (2) with its error band (gray shaded area). Panel a: model with ![]() , α = 0.0, and mmax = 100 M⊙ and linear fit with
, α = 0.0, and mmax = 100 M⊙ and linear fit with ![]() . Panel b: model with
. Panel b: model with ![]() , α = 0.0, and mmax = 100 M⊙ and linear fit with
, α = 0.0, and mmax = 100 M⊙ and linear fit with ![]() . Panel c: model with
. Panel c: model with ![]() , α = −2.0, and mmax = 100 M⊙ and linear fit with
, α = −2.0, and mmax = 100 M⊙ and linear fit with ![]() . Panel d: model with
. Panel d: model with ![]() , α = 0.0, and mmax = 1.0 M⊙ and linear fit with
, α = 0.0, and mmax = 1.0 M⊙ and linear fit with ![]() .
.
Current usage metrics show cumulative count of Article Views (full-text article views including HTML views, PDF and ePub downloads, according to the available data) and Abstracts Views on Vision4Press platform.
Data correspond to usage on the plateform after 2015. The current usage metrics is available 48-96 hours after online publication and is updated daily on week days.
Initial download of the metrics may take a while.