Open Access
Fig. 8
Download original image
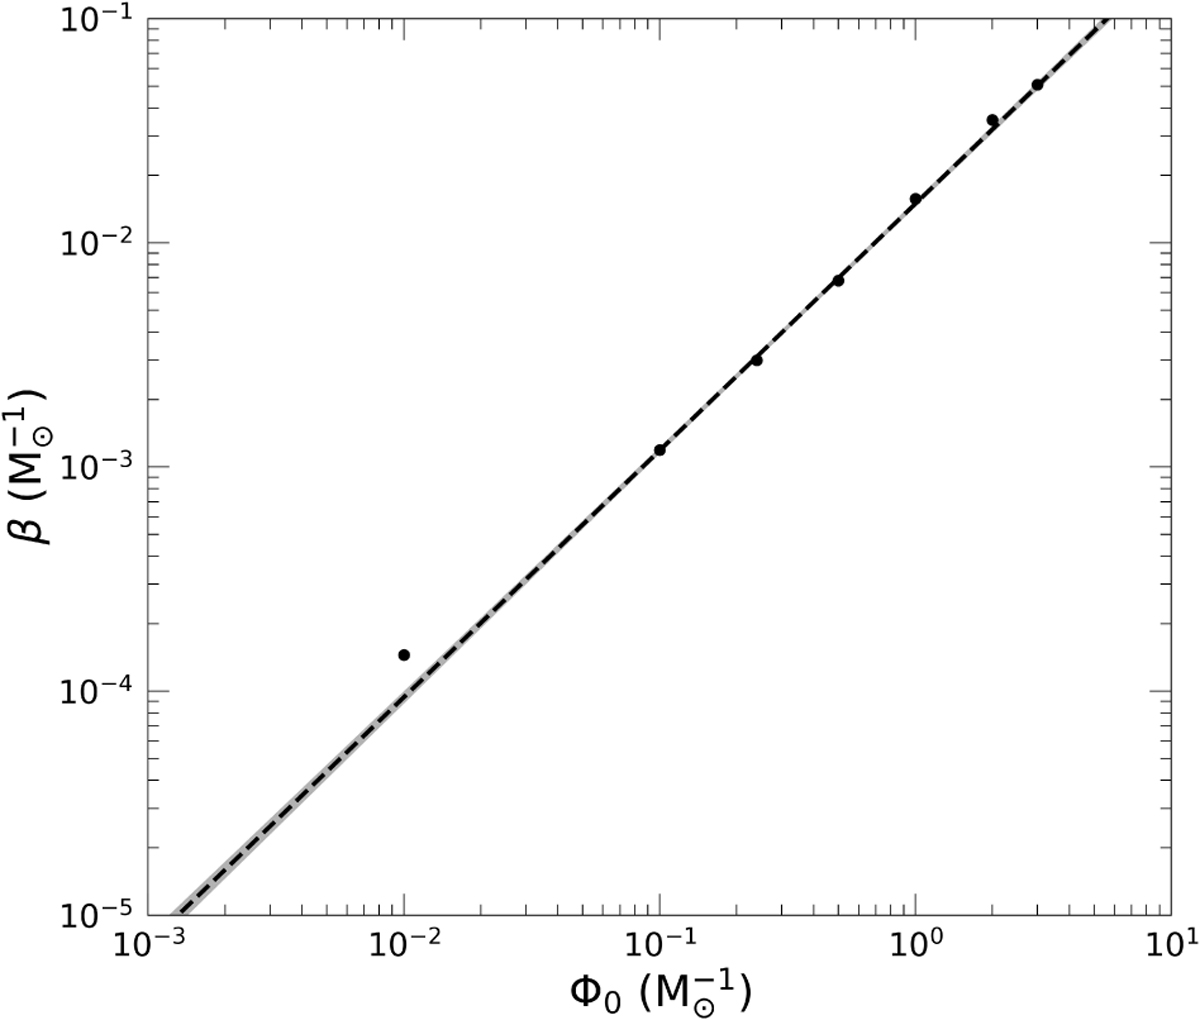
Relation between β and Φ0 for a FG with an age of 100 Myr. The black dots are the obtained values from fits of rh(m) given in Table 1, while the dashed line is a linear fit log(β) = a log(Φ0) + b, with a = 1.10 ± 0.02 and b = −1.83 ± 0.01, with the corresponding error band (gray shaded area).
Current usage metrics show cumulative count of Article Views (full-text article views including HTML views, PDF and ePub downloads, according to the available data) and Abstracts Views on Vision4Press platform.
Data correspond to usage on the plateform after 2015. The current usage metrics is available 48-96 hours after online publication and is updated daily on week days.
Initial download of the metrics may take a while.