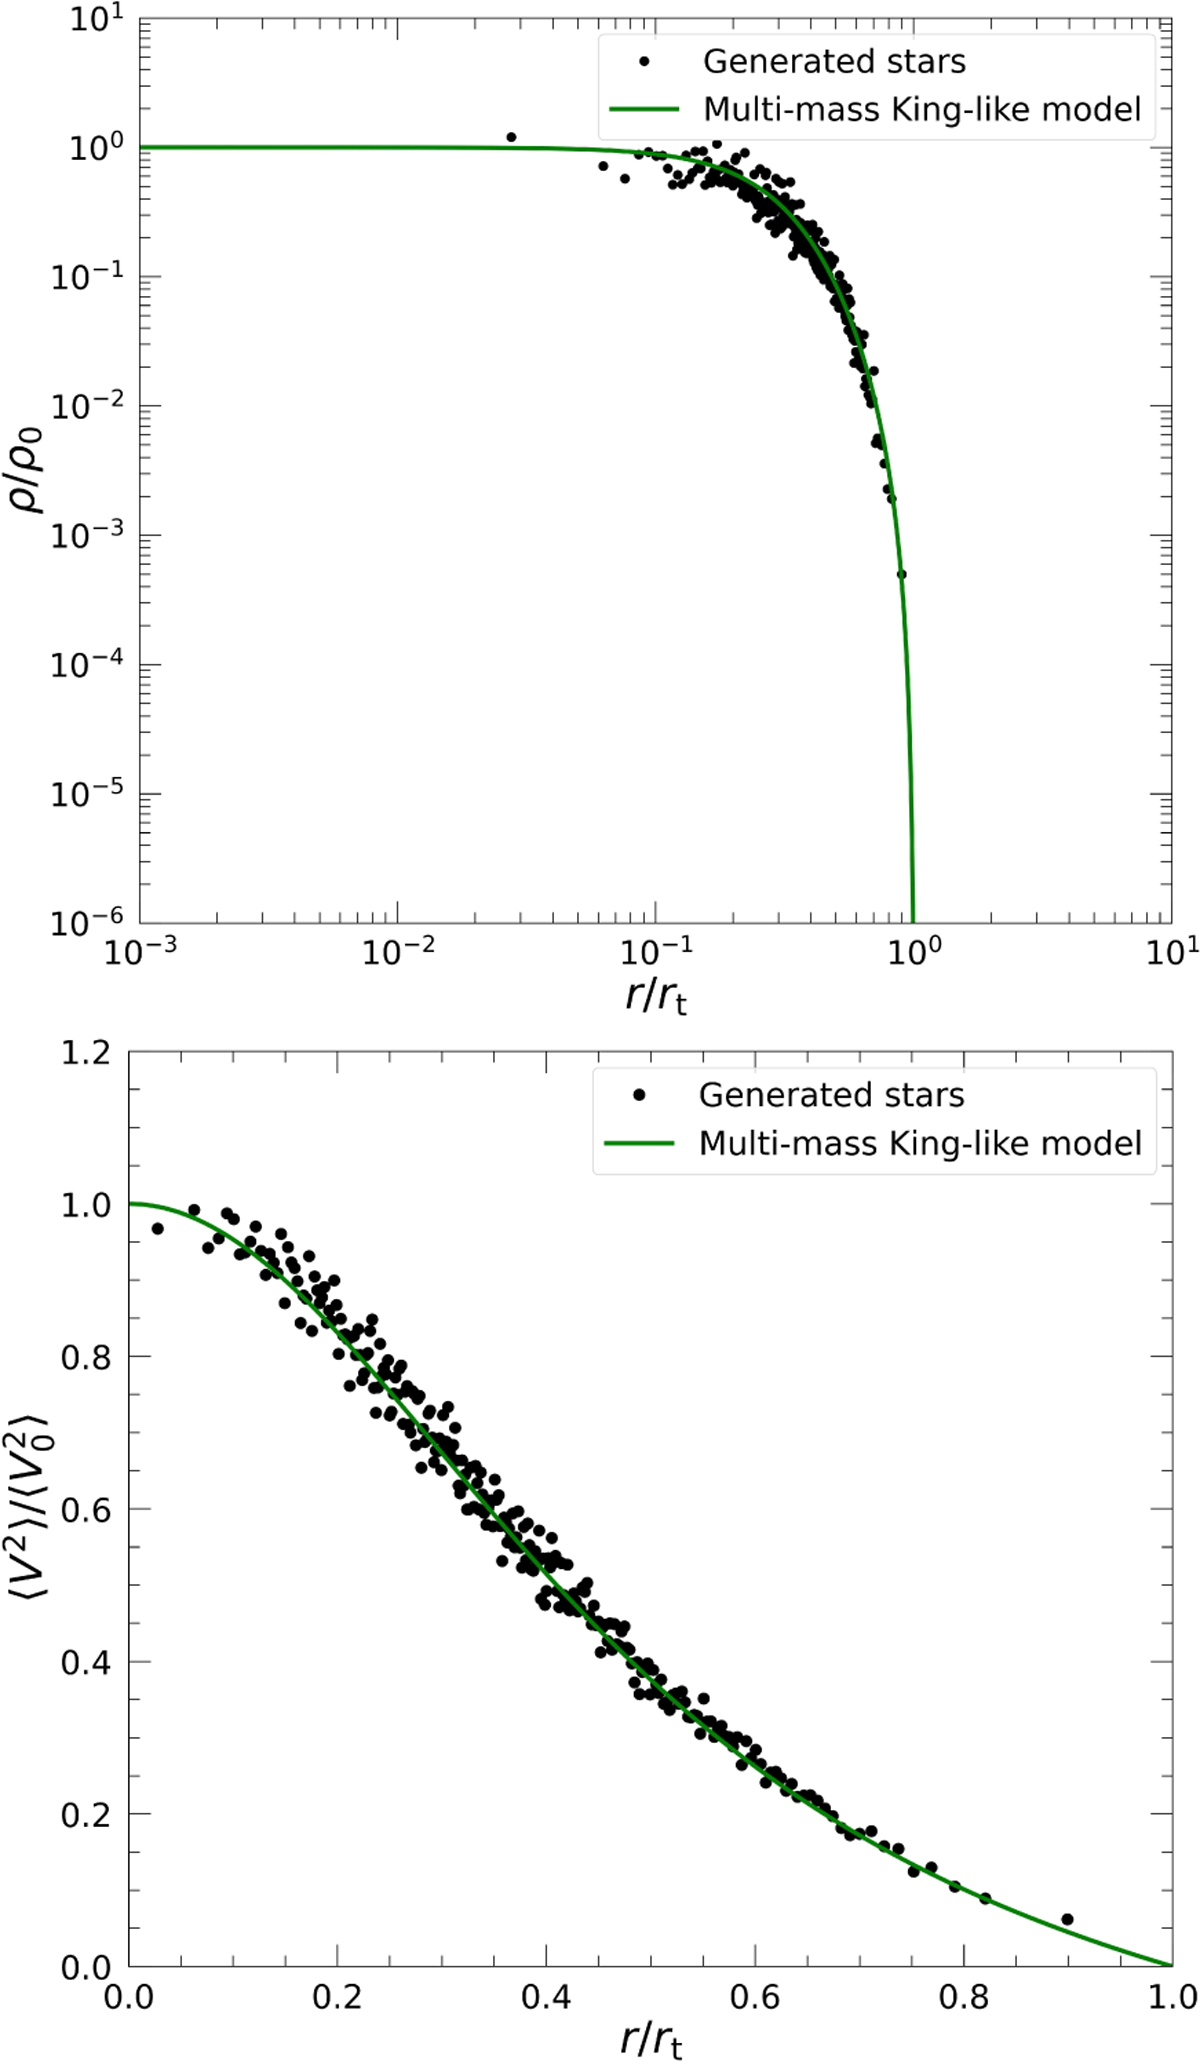
Fig. B.1
Download original image
Normalized mass density (upper panel) and mean square velocity (lower panel) radial profiles for N = 50 000 generated stars (black circles) and the corresponding theoretical prediction (green line) for a model with ![]() and a double power law mass function with slope α1 = −1.3 for 0.1 ≤ m/M⊙ < 0.5 and α2 = −2.3 for 0.5 ≤ m/M⊙ ≤ 100.
and a double power law mass function with slope α1 = −1.3 for 0.1 ≤ m/M⊙ < 0.5 and α2 = −2.3 for 0.5 ≤ m/M⊙ ≤ 100.
Current usage metrics show cumulative count of Article Views (full-text article views including HTML views, PDF and ePub downloads, according to the available data) and Abstracts Views on Vision4Press platform.
Data correspond to usage on the plateform after 2015. The current usage metrics is available 48-96 hours after online publication and is updated daily on week days.
Initial download of the metrics may take a while.