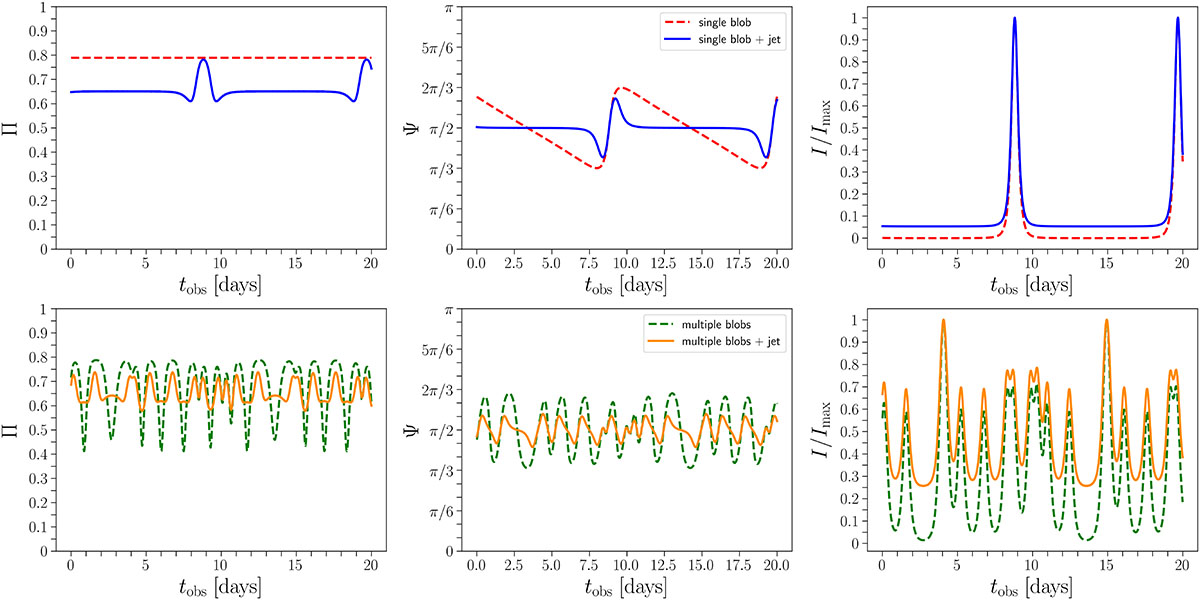
Fig. 3.
Download original image
Polarization degree, Π (left panels); electric vector position angle (EVPA), Ψ (middle panels); and intensity normalized to its maximum value, I/Imax (right panels) plotted as a function of time in the observed frame, tobs, measured in days. The jet has a cylindrical shape. Top panels: Emission from a single blob (Nblobs = 1 and ηjet = 0; dashed line) and from a single blob plus a nearly axisymmetric jet (Nblobs = 1 and ηjet = 1; solid line). Bottom panels: Emission from multiple blobs (Nblobs = 10 and ηjet = 0; dashed line) and from multiple blobs plus a nearly axisymmetric jet (Nblobs = 10 and ηjet = 1; solid line).
Current usage metrics show cumulative count of Article Views (full-text article views including HTML views, PDF and ePub downloads, according to the available data) and Abstracts Views on Vision4Press platform.
Data correspond to usage on the plateform after 2015. The current usage metrics is available 48-96 hours after online publication and is updated daily on week days.
Initial download of the metrics may take a while.