Fig. 1
Download original image
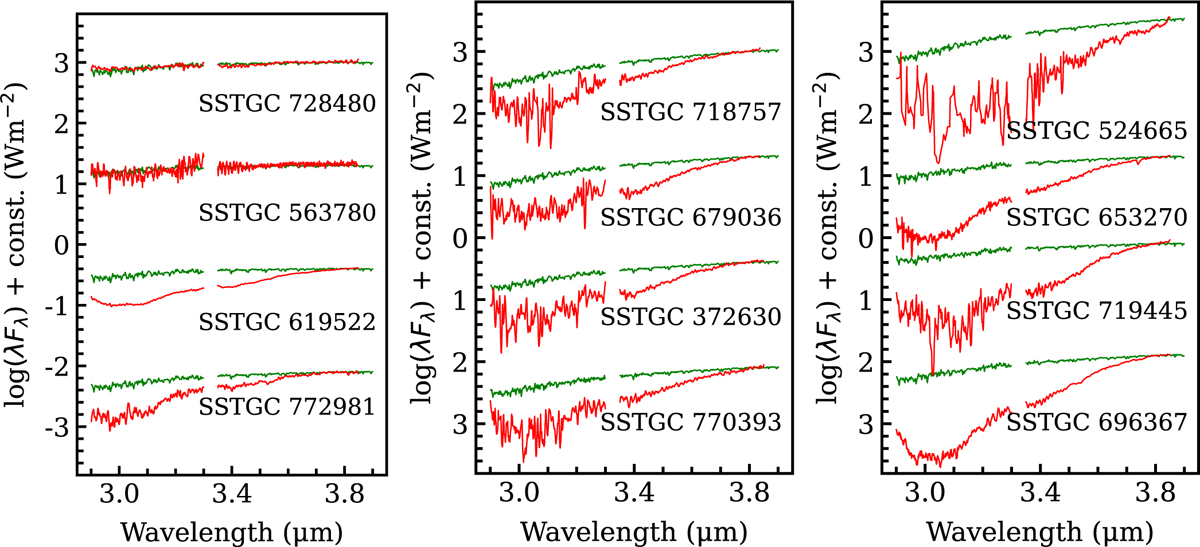
GNIRS L-band spectra of 12 red sources in the CMZ. The observed spectra (red) are vertically offset for clarity and approximately ordered by increasing strength of the broad H2O ice absorption band centred at 3 μm. To illustrate the varying depth of this feature, the best-fit IRTF/SpeX M5.5III template spectrum (Rayner et al. 2009) is shown in green for each source. These templates were reddened using the foreground extinction estimate derived from our SED fitting procedure (see Sect. 4.1). Together with the 3 μm ice absorption profile, they reproduce the overall continuum shape and slope of the observed spectra.
Current usage metrics show cumulative count of Article Views (full-text article views including HTML views, PDF and ePub downloads, according to the available data) and Abstracts Views on Vision4Press platform.
Data correspond to usage on the plateform after 2015. The current usage metrics is available 48-96 hours after online publication and is updated daily on week days.
Initial download of the metrics may take a while.