| Issue |
A&A
Volume 707, March 2026
|
|
|---|---|---|
| Article Number | A9 | |
| Number of page(s) | 22 | |
| Section | Interstellar and circumstellar matter | |
| DOI | https://doi.org/10.1051/0004-6361/202557497 | |
| Published online | 27 February 2026 | |
Backlighting young stellar objects in the Central Molecular Zone
An ensemble-averaged abundance structure of methanol ices
1
Department of Science Education, Ewha Womans University,
52 Ewhayeodae-gil,
Seodaemun-gu,
Seoul
03760,
Republic of Korea
2
Department of Artificial Intelligence and Software, Ewha Womans University,
52 Ewhayeodae-gil,
Seodaemun-gu,
Seoul
03760,
Republic of Korea
3
Institute for Astronomy, University of Hawaii,
2680 Woodlawn Drive,
Honolulu,
HI
98622,
USA
4
Korea Astronomy and Space Science Institute,
776 Daedeok-daero,
Yuseong-gu,
Daejeon
34055,
Republic of Korea
5
University of Science and Technology, Korea (UST),
217 Gajeong-ro,
Yuseong-gu,
Daejeon
34113,
Republic of Korea
★ Corresponding author: This email address is being protected from spambots. You need JavaScript enabled to view it.
Received:
30
September
2025
Accepted:
8
January
2026
Abstract
Context. The Central Molecular Zone (CMZ) of the Milky Way contains a substantial reservoir of dense molecular gas, where numerous young stellar objects (YSOs) and dense cloud cores have been identified, offering valuable opportunities to investigate star formation in the nuclear regions of spiral galaxies. However, the large distance and severe foreground extinction complicate detailed interpretation, particularly of infrared absorption features from various ice species that trace the chemical composition and evolutionary state of these embedded objects.
Aims. To better characterise YSOs and dense cores in this region, we combined spectra from multiple YSOs, each likely backlit by a giant star, allowing us to probe their outer layers and derive an ensemble-averaged ice abundance profile.
Methods. We obtained L-band spectra of 15 point-like sources with extremely red colours using GNIRS on Gemini North, enabling measurements of the CH3OH absorption feature at 3.535 μm. A subset of these sources was also observed in the K band. To better constrain the foreground extinction and H2O ice column densities, we combined these data with K-band and mid-infrared spectra from our previous observations using NASA/IRTF and Spitzer/IRS.
Results. We found that the CH3OH abundance in the CH3OH-CO2 ice mixture (traced by the 15.4 μm shoulder) lies between 2-5%, reaffirming previous findings and confirming that it is systematically lower than the 5-15% typically observed in the Galactic disc. Furthermore, by using the local excess of foreground extinction as a proxy for the projected distance between a backlit source and the centre of a YSO, we found that the CH3OH abundance relative to solid CO2 remains at the ∼10% level in the inner regions of the envelope, but increases sharply to ∼30% in the outer regions.
Conclusions. The relatively low methanol ice abundance may reflect the unique chemical environment of the CMZ, including variations in elemental abundances and surface reaction pathways on dust grains. However, our results offer an alternative interpretation: since our sample is biased towards massive and luminous YSOs, intense heating from the central protostar may have caused substantial sublimation of methanol ice in the inner regions of their envelopes, thereby systematically lowering the observed CH3OH/H2O ice ratios.
Key words: astrochemistry / stars: protostars / ISM: abundances / dust, extinction / ISM: molecules / Galaxy: center
© The Authors 2026
 Open Access article, published by EDP Sciences, under the terms of the Creative Commons Attribution License (https://creativecommons.org/licenses/by/4.0), which permits unrestricted use, distribution, and reproduction in any medium, provided the original work is properly cited.
This article is published in open access under the Subscribe to Open model. This email address is being protected from spambots. You need JavaScript enabled to view it. to support open access publication.
1 Introduction
As the nearest benchmark for studying nuclear molecular zones in spiral galaxies, the Central Molecular Zone (CMZ) of the Milky Way contains a substantial reservoir of dense molecular gas, accumulated through bar-driven inflows. While strong shear and turbulence are thought to inhibit star formation in this region (e.g. Yusef-Zadeh et al. 2009; An et al. 2011), a growing body of evidence indicates that the CMZ continues to host significant star-forming activity. This is supported by the presence of compact H II regions (Gaume et al. 1995; Meng et al. 2019, 2022), abundant H2O and methanol masers (Caswell et al. 2010; Longmore et al. 2017), and a population of young stellar objects (YSOs) (An et al. 2009, 2011, 2017; Jang et al. 2022), along with young massive star clusters containing O- and B-type stars (Mauerhan et al. 2010; Dong et al. 2012). More recently, ALMA observations have revealed a large number of deeply embedded protostars and associated bipolar SiO (5-4) outflows (Ginsburg et al. 2018; Walker et al. 2021), while JWST imaging has uncovered shocked molecular hydrogen structures and protostars, further confirming ongoing star formation in the region (Crowe et al. 2025).
Among the various tracers of star formation, YSOs and compact cloud cores (e.g. Hatchell & Fuller 2008; Heyer et al. 2016) not only mark ongoing star-forming activity but also provide insights into the chemical composition of the natal molecular clouds that will give rise to the next generation of stars. In particular, infrared (IR) spectroscopy reveals a rich set of absorption features arising from the vibrational and rotational transitions of ice species such as H2O, CO, CO2, and CH3OH (e.g. Chiar et al. 1995; Gerakines et al. 1999; Whittet et al. 1998;
Pontoppidan et al. 2008; Boogert et al. 2011; Öberg et al. 2011; Boogert et al. 2015, 2022). These molecules form on icy dust grains under cold, dense conditions, beginning with the gravitational collapse of interstellar clouds, and are subsequently processed as the central protostar evolves. This processing includes thermal annealing, crystallisation, molecular segregation, and eventual sublimation, each reflecting changes in the thermal and chemical environment (Boogert et al. 2015). Therefore, observations of IR ice absorption bands provide a powerful diagnostic tool for probing the structural and evolutionary properties of YSOs and cloud cores.
In this context, both direct and indirect detections of methanol (CH3OH) ice in point-like sources with extremely red colours in the CMZ (An et al. 2009, 2011, 2017; Jang et al. 2022) suggest that these objects are in an early stage of YSO evolution. The 15 μm CO2 absorption band is commonly observed towards quiescent dark clouds, where it typically exhibits a relatively narrow profile, comprising contributions from pure CO2 ice and mixtures with H2O (peaked at 15.3 μm) and/or CO (15.1 μm). In contrast, significantly broader 15 μm features were found in the Spitzer/IRS mid-IR spectra of CMZ sources, due to the presence of a 15.4 μm shoulder component arising from CO2 ice mixed with species like CH3OH. It is attributed to Lewis acid-base interactions that shift the CO2 asymmetric stretching mode to longer wavelengths (Ehrenfreund et al. 1999; Dartois et al. 1999). Since methanol ice forms under low temperatures (T < 15 K; Cuppen et al. 2009) and relatively high extinctions (AV ≳ 9; Boogert et al. 2011; Chiar et al. 2011; Whittet et al. 2011), it serves as a sensitive tracer of cold, dense environments characteristic of the earliest stages of star formation. Accordingly, An et al. (2011) interpreted the observed features as indirect evidence of the presence of CH3OH ice and identified 16 objects as YSOs and 19 as candidate YSOs. This interpretation was later confirmed by follow-up near-IR spectroscopy (An et al. 2017; Jang et al. 2022), which directly detected the 3.535 μm absorption band of solid CH3OH in many of the same sources. These results demonstrated that methanol ice can comprise up to 17% ± 3% relative to H2O, validating the earlier interpretation and confirming the presence of abundant CH3OH ice in these red CMZ objects.
However, these follow-up studies consistently reported a lower abundance of CH3OH with respect to H2O in CMZ objects compared to values found in star-forming clouds within the Galactic disc. This discrepancy may reflect intrinsic differences in the chemical composition of CMZ clouds and/or variations in the chemical reaction networks operating under the extreme physical conditions of the CMZ interstellar medium (ISM). To better understand the origin of this systematic difference in the chemical properties of CMZ YSOs, it is useful to investigate the spatial distribution and structure of ice species within YSOs. For example, Pontoppidan et al. (2008) used observations of background stars in the Ophiuchus cloud to spatially resolve the distribution of ices within the extended envelope of a YSO. However, at a distance of ~8 kpc from the Sun (Reid et al. 2014), direct observations of the detailed structure of individual YSO envelopes in the CMZ are challenging; for example, most CMZ objects appear as point-like sources in the mid-IR bands of Spitzer/IRAC images (FWHM~2"; Ramírez et al. 2008).
On the other hand, near- and mid-IR spectroscopy can provide a unique opportunity to probe the internal structure of YSO envelopes through absorption features. From our near-IR spectroscopic observations (An et al. 2017; Jang et al. 2022), we found that many of the YSO candidates previously identified from Spitzer mid-IR spectra (An et al. 2011) exhibit strong 2.3 μm CO band-head absorption, a feature characteristic of (super-)giant stars. The extreme red colours of these objects further suggest that their near-IR fluxes are significantly attenuated by dust. These findings indicate that the observed near- and mid-IR spectra are, in fact, composites of two sources along the line of sight: the mid-IR emission is dominated by the YSO in the early evolutionary stage, while the near-IR absorption originates primarily from a background giant star situated behind the YSO’s extended envelope. Such a configuration, in which a background giant star backlights a foreground YSO, is plausible in the CMZ given its high source density. This backlighting scenario naturally could explain both the spectral energy distributions (SEDs) of Spitzer’s red point-like sources in the CMZ and their observed absorption features.
Building on the unique backlighting configuration of CMZ YSOs, we aim to expand the sample of such systems and use them as probes of how ice is distributed within YSO envelopes. To address this question, we carried out follow-up near-IR spectroscopic observations of 23 red point-like sources that exhibit a strong CO2 shoulder feature, and measured the column densities (N) of H2O and CH3OH ice. By combining these measurements with our previous mid-IR spectral data, we present a comprehensive analysis of these CMZ objects, including extinction estimates from both foreground dust and the envelopes of YSOs. Assuming that our sample represents YSOs at a similar evolutionary stage, we investigated the internal distribution of methanol ice within their envelopes. This work presents the first effort to model an ensemble-averaged radial profile of CH3OH ice abundance as a function of projected radial distance within YSO envelopes in the CMZ.
This paper is organised as follows. In Sect. 2, the Gem-ini/GNIRS observations of red point-like sources in the CMZ are described, along with the data reduction procedures. In Sect. 3, the GNIRS spectra are supplemented with existing near-IR data and combined with mid-IR spectra to produce the composite SEDs of the CMZ sources. In Sect. 4, the modelling of the overall SED from near- to mid-IR spectra is presented, from which the foreground dust extinction is derived. Column densities of H2O and CH3OH measured from the GNIRS spectra are also reported. The ice compositions of the CMZ objects are examined and compared with those in the Galactic disc. In Sect. 5, the derived ice abundances and extinction estimates are combined to construct an ensemble-averaged radial profile of methanol ice abundance. A summary of the results and a discussion of the observed trends are given in Sect. 6.
2 Gemini/GNIRS observations
2.1 Sample selection
We used the Gemini Near-IR Spectrograph (GNIRS; Elias et al. 2006a,b) on Gemini North to obtain K- and L-band spectra of 15 CMZ objects, as listed in Table 1. These targets were primarily selected from An et al. (2011), which reported mid-IR spectroscopic observations with Spitzer/IRS. Their near- and mid-IR colours are extremely red, with 1.6 ≤ K - [3.6] ≤ 4.8 and 2.4 ≤ [3.6] - [8.0] ≤ 5.3, which was the basis for their inclusion in the original Spitzer/IRS follow-up observations. These colours distinguish them clearly from other stars towards the CMZ, even though typical CMZ stars already appear significantly reddened due to large foreground dust extinction (AV ~ 30 mag).
The GNIRS follow-up targets were primarily selected to maximise the likelihood of detecting a high CH3OH ice abundance. The last column of Table 1 shows the classification of each object from An et al. (2011), which was determined based on the strength of the 15.4 μm shoulder absorption feature of CO2 ice. Since the 15.4 μm feature is attributed to CO2 ice mixed with CH3OH (An et al. 2017; Jang et al. 2022), objects classified as YSOs are those for which An et al. (2011) assigned greater weight to the presence of a strong and statistically significant detection of this feature. In contrast, sources classified as possible YSOs show either weaker 15.4 μm absorption or less significant detections. In total, 12 of the brightest sources (L < 12.2 mag) from An et al. (2011) were observed, including 5 YSOs and 7 possible YSOs.
In addition, three objects (SSTGC 425399, 619964, and 696367) previously classified as known stars in An et al. (2011), based on a literature search, were also included in this study. Among them, SSTGC 619964 and SSTGC 696367 were identified as OH/IR stars in Lindqvist et al. (1992). However, our understanding of the red point-like objects in An et al. (2011) has since been significantly revised, following the realisation that many of these sources exhibit spectroscopic signatures of both young and evolved stars due to overlapping sightlines (An et al. 2017; Jang et al. 2022), as is further demonstrated in this work. Although these sources show relatively weak 15.4 μm shoulder features, their IR colours remain as red as those of the YSO candidates in An et al. (2011), providing an opportunity to explore the range of physical conditions and geometries of YSOs in the CMZ.
Most of our CMZ objects are likely Class 0 YSOs, i.e. in an early stage of evolution (Lada 1987; Andre et al. 1993), as is indicated by the large column of ices, including CO2, along the line of sight. Moreover, As is discussed in Appendix D, neither H2O nor CH3 OH maser emission was detected from these targets, consistent with them being too young to excite Class I masers, which are collisionally pumped in shocks and outflows, or Class II masers, which are radiatively pumped by IR emission from warm dust close to the protostar.
Red CMZ objects observed with Gemini/GNIRS.
2.2 Observations and data reduction
Queue observations were carried out at Gemini North in 2017 and 20221 to obtain L-band spectra for all selected targets. The GNIRS was used in long-slit mode with the 10.44 lines mm−1 grating and the long red camera (0.05″pixel−1). The slit width was matched to the seeing during natural seeing guided observations, providing a spectral resolving power of R = λ/∆λ ~ 400500 at ~3.5 μm, where the CH3OH absorption band is located. In addition, three of the L-band targets were also observed in the K -band during the 2017 run (see Table 1). These observations employed the 31.7 lines mm−1 grating with the short blue camera. For both L- and K -band observations, a standard ABBA dithering pattern was used to optimise sky subtraction and achieve a sufficient signal-to-noise ratio (S/N). The total on-source exposure time per exposure sequence was 16-32 min in K and 8-40 min in L, depending on the source brightness.
Standard data reduction procedures were performed using the IRAF/Gemini package (Tody 1986, 1993; Fitzpatrick et al. 2024)2. Flat-fielding and wavelength calibration frames were acquired with GCAL, the facility calibration unit, as part of the observing sequences. Corrected individual frames obtained in ABBA dithering mode were combined. Wavelength calibration for the K-band spectra was performed using arc lamp lines, while the Maunakea atmospheric transmission model (for an airmass of 1.0 and a precipitable water vapour column of 1.0 mm) was employed for the L band. Telluric absorption features were corrected using observations of bright standard stars with spectral types B3-A5, taken with the same instrumental configuration as the science targets and observed immediately before or after the target to ensure airmass matching. Telluric corrections were applied using the Spextool package (version 4.0; Cushing et al. 2004)3.
Repeat L-band observations were obtained for four targets (SSTGC 563780, SSTGC 619964, SSTGC 696367, and SSTGC 799887) at different epochs to assess potential systematics in the observing conditions and data reduction. With the exception of SSTGC 563780, the L-band fluxes measured at two epochs differ systematically by up to ~50%, suggesting uncertainties arising from the extraction and calibration of the spectra. In particular, SSTGC 619964 and SSTGC 799887 lie in very crowded regions, where contamination from nearby sources likely affected the source extraction. Among the targets with only single L-band observations, SSTGC 524665 and SSTGC 770393 also have nearby sources that may have contributed to their measured fluxes.
The S/N of each spectrum was estimated by fitting a low-order polynomial around ~3.7 μm, where no strong absorption features are present. The typical S/N is ~40, which is sufficiently high to allow for the confident measurement of CH3OH column densities above ~1 × 1017 cm−2. From telluric absorption lines in the standard star spectra, the resolving power was measured to be in the range R ~ 400-500. For the repeat observations, we carried out independent modelling of spectra from each exposure sequence before combining the resulting parameter estimates, including column densities and foreground extinctions (see below).
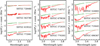 |
Fig. 1 GNIRS L-band spectra of 12 red sources in the CMZ. The observed spectra (red) are vertically offset for clarity and approximately ordered by increasing strength of the broad H2O ice absorption band centred at 3 μm. To illustrate the varying depth of this feature, the best-fit IRTF/SpeX M5.5III template spectrum (Rayner et al. 2009) is shown in green for each source. These templates were reddened using the foreground extinction estimate derived from our SED fitting procedure (see Sect. 4.1). Together with the 3 μm ice absorption profile, they reproduce the overall continuum shape and slope of the observed spectra. |
3 IR spectra of red CMZ objects
3.1 Composite spectra
Figure 1 presents the GNIRS spectra of the 12 red CMZ objects. The spectra are vertically offset with arbitrary zero points and are ordered by increasing strength of the broad H2O ice absorption band centred at 3 μm, whose wing extends across much of the L band. Some objects, such as SSTGC 728480 and SSTGC 563780, exhibit nearly flat spectra with very weak or absent H2O ice absorption. In contrast, the majority of our sample shows strong band absorption, suggesting significant extinction due to dense molecular clouds along the line of sight. Additionally, Figure 2 displays the spectra of the three objects for which both K- and L-band observations were obtained. It reveals CO bandhead absorption features at 2.3-2.4 μm, commonly associated with stellar photospheres. These features are indicative of (super-)giant stars, and their presence, together with the extremely red SED and strong molecular absorption bands, suggests the superposition of such stars behind a YSO envelope or a compact cloud core (see Jang et al. 2022).
In the following analysis, we combined the GNIRS spectra with mid-IR spectra obtained from Spitzer/IRS (An et al. 2011) to enable a comprehensive characterisation of the red pointlike sources in the CMZ. Figure 3 shows an example of such a composite spectrum (SSTGC 799887). The GNIRS spectra cover the wavelength range 2-4 μm, while the low-resolution Spitzer spectra, obtained with the short-low (SL) and long-low (LL) modules, span 5-35 μm. As is detailed below, this multiwavelength analysis allowed for the simultaneous estimation of key absorption features, including those of H2O and CH3OH, as well as the dust extinction along the line of sight.
However, the GNIRS spectra occasionally exhibited significant flux discrepancies with the IRS spectra near the 4-5 μm boundary. These offsets likely reflect a combination of observational limitations in the CMZ and variations in spatial resolution and aperture size between instruments. Spectral extraction in this environment is complicated by high source density, where crowding affects background subtraction and source isolation. The large apertures of the IRS modules (3.7" for SL and 10.7" for LL) are particularly prone to contamination from nearby sources, while GNIRS, with its higher spatial resolution, samples a more localised region. Morphological differences further contribute to these mismatches, as many CMZ sources appear compact in the near-IR but display extended emission at longer wavelengths. In contrast, our ground-based GNIRS observations benefit from higher spatial resolution but are subject to limitations in atmospheric correction, which inevitably lead to systematic uncertainties in the absolute flux calibration. The extended nature of the emission in the L band further increases slit-loss uncertainties, leading to flux mismatches between the K-and L-band spectra. Overall, both the GNIRS and IRS spectra are affected by distinct sources of systematic uncertainty, which can introduce offsets in the absolute flux calibration and continuum level across the full spectral range.
For these reasons, we anchored all spectra to broadband photometric measurements, both to mitigate source confusion in the large-aperture IRS data and to establish a robust zero-point flux calibration for the GNIRS spectra. To place the GNIRS and IRS spectra on a consistent flux scale, we matched them to broadband photometry from the Galactic plane survey conducted as part of the UKIRT IR Deep Sky Survey (UKIDSS; Lucas et al. 2008), and from the Spitzer/IRAC survey of the Galactic centre (GAL-CEN; Ramírez et al. 2008). We used K-band photometry to scale the K-band spectra, computing synthetic magnitudes using the corresponding filter response function available from the SVO filter profile service4. Similarly, the [3.6] photometry was used to set the flux scale for the L-band spectra. For the IRS spectra, we adopted the [8.0] photometry for scaling, as the other IRAC bands ([4.5] and [5.8]) fall in wavelength regions that are either only partially covered or entirely missing from the spectra.
Figure 3 shows the spectra calibrated in this way, with the broadband photometry over-plotted as filled circles at their respective effective wavelengths. We note that the [8.0] photometric point lies below the observed spectra, owing to the strong silicate absorption feature that affects the long-wavelength side of its passband. Because the K-, L-, and IRS spectral segments do not overlap, a direct assessment of their relative flux scaling is not possible. Nonetheless, the consistency of the flux calibration can be evaluated through SED modelling, introduced in Sect. 4.1. The solid blue lines in Fig. 3 show the corresponding best-fitting models, and any residual offsets with respect to the data are discussed therein.
As the flux uncertainties in the data products are often underestimated, we scaled them by a multiplicative factor derived from local pseudo-continuum regions free of strong absorption features. Specifically, we fitted a second-order polynomial to 2.10-2.25 μm for the K-band spectra and 3.50-3.70 μm for the L band. The scaling factor was chosen to match the median flux uncertainty to the standard deviation of the logarithmic flux in each range. This yielded more realistic random uncertainties of 1-4% for most L-band spectra, although the spectrum of SSTGC 524665 shows uncertainties as high as 17%. In addition, we applied a second-order Savitzky & Golay (1964) filter to the spectra to reduce noise while preserving the spectral resolution.
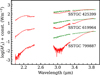 |
Fig. 2 Same as Figure 1, but for sources that have both K- and L-band spectra from GNIRS observations. |
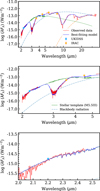 |
Fig. 3 Composite IR spectrum of a red CMZ object (SSTGC 799887) and modelling of the SED. The observed spectra are shown as a solid red line, constructed by combining near-IR data from Gemini/GNIRS with mid-IR data from Spitzer/IRS. Circles represent photometric measurements from UKIDSS and Spitzer/IRAC, which were used to set the flux scale of the spectra (see text). The solid blue line shows the best-fitting model to the observed spectra, which included the following components: (1) a template of an M5.5-type giant from the IRTF/SpeX spectral library (Rayner et al. 2009) (green line); (2) a two-component blackbody continuum (dashed blue and orange lines); (3) the 3 μm band of solid H2O ice, using the template from GC IRS 7 (Jang et al. 2022); and (4) the 10 μm and 18 μm silicate bands from the GC IRS 3 spectrum (Kemper et al. 2004). Other weaker absorption features were not included in the modelling. Spectra and their best-fitting models for the additional objects are shown in Appendix A. |
Red CMZ objects with IRTF/SpeX spectra.
3.2 NASA IRTF/SpeX
Jang et al. (2022) obtained K- and L-band spectra of red CMZ objects with a medium-resolution spectrograph SpeX (Rayner et al. 2003) on the 3.2m NASA IR Telescope Facility (IRTF). Their data are comparable to the GNIRS spectra presented here in both spectral resolution and wavelength coverage. Like our GNIRS sample, the IRTF data combined with IRS observations span the 2-35 μm range. Eleven of these objects are bright enough to be included in An et al. (2011), and they also exhibit extreme red colours ([3.6]-[8.0] ≳ 3.0). Two of these (SSTGC 653270 and SSTGC 696367) were also observed in this work; for these sources, we supplemented our GNIRS spectra with the K-band IRTF/SpeX data. The spectra of the remaining IRTF/SpeX objects, excluding one with very low S/N, are listed in Table 2, and were combined with the IRS spectra in the same manner as the GNIRS+IRS composite spectra.
The IRTF/SpeX observations were performed simultaneously in the K and L bands using a single instrumental set-up, thereby providing a consistency check on the reliability of the flux zero-point adjustments applied to match the photometric measurements. For the eight objects listed in Table 2, we found that the L-band spectra required a scaling factor roughly twice that of the K band to match the photometry. These offsets likely reflect the extended nature of the emission arising from YSO envelopes, which becomes more prominent at longer wavelengths. This interpretation is supported by the fact that the objects appear essentially point-like in the K band, but more extended in the L band (An et al. 2017). It is also possible that the lower spatial resolution of the IRAC [3.6] images used for L-band scaling may have included flux contributions from nearby sources, in contrast to the higher-resolution UKIDSS K-band images used for the K-band scaling; however, this effect is likely less significant than that of the extended emission.
In total, we have 23 objects with 3-35 μm composite spectra assembled from Gemini/GNIRS, IRTF/SpeX, and Spitzer/IRS observations. About half of these also have K-band spectra. For the remainder, we used UKIDSS K-band photometry to constrain their physical parameters, as is detailed below. The full set of composite spectra, corrected for zero-point flux offsets and including scaled flux uncertainties, is publicly available via Zenodo5.
4 Spectral analysis and derivation of physical parameters
Most of the observed CMZ objects in this study show deep silicate and H2O ice absorption features, indicating the significant amount of molecular clouds along the line of sight to each object. While foreground dust extinction and column densities of ice species cannot be reliably constrained using broadband photometry alone, the SED traced by IR spectra provides a valuable diagnostic for quantifying such parameters. Below, we performed a global modelling of the SED to extract foreground extinctions, along with the column density of solid H2O with a wide absorption band (Sect. 4.1). We combined this with additional analysis of more localised absorption features from CH3OH ice (Sect. 4.2) to reveal complex structures of dust and ices along each line of sight towards the red CMZ objects.
4.1 Column densities of solid H2 O and foreground extinction
As is shown in Fig. 3, the spectra of the red CMZ objects are characterised by several absorption bands. The near-IR absorption feature at 3 μm is primarily caused by the O-H stretching vibration in solid H2O ice. The broad absorption features centred at 10 μm and 18 μm are characteristic of silicate dust and originate from the Si-O stretching and O-Si-O bending modes, respectively, in amorphous silicate grains. Superimposed on a continuum that would otherwise be nearly flat in λFλ space, or slowly rising towards longer wavelengths, these absorption features are sufficiently broad to modify both the continuum level and the overall shape of the SED. In our previous SED modelling (An et al. 2017; Jang et al. 2022), we found that the overall SED can be well explained by the superposition of two sources of radiation: blackbody emission representing warm dust emission from the extended envelope of a YSO, and the spectrum of a red (super-)giant, both attenuated by significant columns of foreground dust. Given the above considerations, we modelled the composite IR spectra using the following components:
Photospheric component: in the near-IR, many red CMZ objects exhibit CO bandhead absorption at 2.3 μm, indicating the presence of a red (super-)giant along the line of sight to the mid-IR source. Jang et al. (2022) performed detailed spectral fits using the NASA IRTF/SpeX library (Rayner et al. 2009), and showed that varying the template spectral type between late-K and late-M giants only mildly affects the parameter estimates, because, beyond 2 μm, the stellar spectra of late-type giants show little variation in slope. Based on this, we adopted the spectrum of an M5.5III giant (HD 94705) as a representative photospheric component. This choice was also motivated by the fact that K-band spectra are available for only 5 of the 15 GNIRS targets.
H2O ice bands at 3 μm and 13 μm: we utilised the observed IRTF/SpeX spectrum of GC IRS 7 from Jang et al. (2022) to model the 3 μm band, which arises from the O-H stretching mode. In addition, H2O ice exhibits an even broader feature centred at 13 μm, associated with the librational mode. Since the GC IRS 7 spectrum is limited to the near-IR region, we complemented it with a laboratory spectrum of pure H2O ice at 15 K from the Leiden Ice Database for Astrochemistry (LIDA; Rocha et al. 2022) for wavelengths beyond 3.8 μm. Although the laboratory data also include the 6 μm feature, we did not incorporate it, as it only partially accounts for the observed absorption in that region.
Silicate bands at 9.7 μm and 18 μm: following An et al. (2009, 2011), we adopted the mid-IR silicate absorption profile from Kemper et al. (2004). Besides the continuum extinction, the strengths of the silicate features provide a strong constraint on the dust column density along the line of sight. The relative strengths of the two silicate modes were fixed during scaling to match the observed data. The bestfitting peak optical depth at 9.7 μm was converted to AK by multiplying it by 0.99 (Roche & Aitken 1985), which is a factor of two lower than that towards the local ISM (Roche & Aitken 1984; Madden et al. 2022).
Warm dust clouds: as demonstrated by An et al. (2017), the mid-IR continuum of red CMZ objects can be effectively reproduced by emission from two blackbody components, likely originating from the extended envelope of a YSO. According to our modelling (see below), the warmer component, with a temperature of ~300-400 K, dominates the spectral range between ~5 μm and 20 μm, where the photospheric contribution becomes negligible. In contrast, the cooler component, with a temperature of ~100 K, primarily accounts for the rising slope of the spectrum beyond ~20 μm.
We incorporated the components described above into our global SED modelling, assuming the continuum extinction curve from Boogert et al. (2011). In addition to these components, narrower but still significant absorption features are seen in our composite spectra, including the 6 μm and 6.8 μm complexes, and the 15 μm CO2 ice band. Furthermore, the spectrum of SSTGC 799887 in Fig. 3 shows a narrower absorption feature at ~18.7 μm, which is in fact due to over-subtraction of background emission from [S III]. A similar effect is seen at ~10 μm, where over-subtraction at the bottom of the silicate band creates a spurious narrow absorption feature. On the other hand, the emission lines at 33.5 μm and 34.8 μm, from [S III] and [Si II], respectively, could trace the localised emission from the YSO itself. For our modelling, we selected spectral regions free of these features, using only clean continuum segments across the K-, L-, and mid-IR bands (see Appendix A).
The CH3OH ice bands at 3.535 μm and 9.74 μm were not included in our global SED analysis and were instead masked, because both features are highly sensitive to the shape of the local continuum. The 3.535 μm band lies within the broader 3 μm H2O and hydrocarbon absorption complex, while the 9.74 μm band is embedded in the deep 10 μm silicate absorption. Because a global SED fit provides only a coarse approximation to the continuum in these wavelength ranges, the continuum level in both regions is particularly uncertain. We therefore analysed the CH3 OH bands separately, fitting a third-order polynomial to more accurately trace the local baseline (see Sects. 4.2 and C).
In modelling the water-ice absorption, we tied the strength of the 13 μm libration band to the peak optical depth of the 3 μm stretching mode. This choice was motivated by the strong and broad silicate absorption at 10 μm in our CMZ targets, which overlaps with the libration feature and prevents a reliable decomposition. In addition, while some studies isolated the 13 μm band using simplified polynomial continua (e.g. Boogert et al. 2011), we adopted a more physically motivated continuum model based on blackbody dust emission. As a result, the 13 μm feature could not be independently constrained in our fits and was instead anchored to the better-defined 3 μm absorption. We note, however, that the two bands may have probed slightly different lines of sight (see below).
The solid blue lines in Fig. 3 show the best-fitting model for SSTGC 799887, derived as is described above. The model included eight free parameters: a flux normalisation for the near-IR stellar template, temperatures and normalisations for the two blackbody components, foreground extinction affecting the near-IR source, foreground extinction affecting the mid-IR source (including both continuum and silicate absorption), and the column density of solid H2O ice. To derive global parameters that reproduce the overall SED shape, we used curve_fit, the nonlinear least-squares optimisation routine from the SciPy library, applying weights based on the scaled uncertainties in logarithmic flux space. Results for the remaining objects are presented in Appendix A.
Overall, the models reproduce the observed SEDs of the red CMZ sources well, capturing the spectral curvature shaped by the major broad absorption bands. The 2.3 μm CO bandheads are also well matched. However, some local mismatches remain. For instance, the model slightly overestimates the depth of the 3 μm band (middle panel) and underestimates the flux on the shortwavelength side of the 9.7 μm silicate feature. The continuum at wavelengths shorter than 2.2 μm also appears systematically brighter in the model. Most notably, the model underpredicts the IRS flux between 5.5 and 7 μm. This mismatch may partly arise from source contamination in the IRAC photometry used to scale the IRS spectra, as the coarse spatial resolution of IRAC (~2") increases the risk of source contamination in crowded regions. Taken together, these deviations likely reflect a combination of factors, including uncertainties in spectral extraction in the dense CMZ environment, residual uncertainties in flux calibration and background subtraction, and possible limitations in the adopted templates for the 3 μm H2O and 9.7 μm silicate bands in capturing the true continuum and band shapes. Nevertheless, as the model captures the global shape of the SED and the key spectral features, the derived parameters provide a reasonable approximation to the intrinsic spectral properties of the sources.
Results from the global SED fitting are summarised in Table 3 for both the Gemini/GNIRS and IRTF/SpeX samples. Only the three key parameters are reported. In the second and third columns, A*K denotes the foreground extinction in the K band associated with the near-IR photospheric component, while  represents the K-band extinction inferred from the mid-IR spectrum, including the contribution from the silicate absorption bands. The fourth column lists the peak optical depth of the 3 μm H2O ice feature (τ3.0). The corresponding column density is shown in the final column, computed by multiplying τ3.0 by a fixed FWHM of 330 cm−1 for amorphous H2O ice and using a band strength of A = 2 × 10⁻¹⁶ cm molecule−1 (Hagen et al. 1981).
The uncertainties in Table 3 represent the quadrature sum of fitting errors, derived from the covariance matrix, and various systematic uncertainties. The latter include the effect of varying the stellar template between M0IIIb (HD 213893) and M9III (IRAS 15060+0947), with the difference from the default case taken as an effective 2σ uncertainty. To evaluate the impact of the extinction law, we repeated the SED fitting with alternative curves from Indebetouw et al. (2005) and Fritz et al. (2011). The latter is notably steeper in the near-IR, leading to shifts in the derived parameters. The deviations from the default curve (Boogert et al. 2011) were treated as an effective 2σ uncertainty and included in the total error budget for both AK and τ3.0. For N(solid H2O), we adopted a 10% uncertainty in the band strength and included it in the total error budget. For the targets with repeated observations, the differences in A*K or τ3.0 between individual spectra exceed the statistical uncertainties but remain well below the combined systematic uncertainties. In such cases, half of the observed differences were added in quadrature to the total error budget. Upper limits are quoted at the 3σ level, calculated from the total error budget.
Several objects in this study overlap with Jang et al. (2022). Specifically, in addition to the eight sources listed as the IRTF/SpeX sample in Table 3, three objects (SSTGC 653270, SSTGC 696367, and SSTGC 719445) were also observed in the L band with Gemini/GNIRS. The unweighted mean and standard deviation of the differences are 2.5 ± 0.7 mag in A*K and -0.08 ± 0.44 in τ3.0, indicating systematically higher extinction and lower optical depth in this study. These offsets primarily reflect our revised modelling approach, which incorporates the extended wavelength coverage up to 35 μm. Nevertheless, the dispersion remains well below the level of the total systematic uncertainties.
As is shown in the top panel of Fig. 4,  ranges from 2 to 5 mag, corresponding to AV ~ 18-45 mag. In contrast, A*K spans a substantially larger range of 4-15 mag. The systematic excess of A*K over
  indicates that the near-IR stellar template requires stronger attenuation than what is implied by the mid-IR silicate bands. Together with the presence of CO absorption bandheads in many of our CMZ spectra, this enhanced extinction supports the interpretation that our composite spectra combine two sources along nearly the same line of sight (Jang et al. 2022).
Figure 5 illustrates the light-ray geometry probed by our composite spectra. The photospheric near-IR emission from a background giant star passes through the extended dusty envelope of a protostar and therefore encounters a deeper column of material than the mid-IR emission emerging from the protostar’s core. At the distance of the CMZ, the two light rays are unresolved and their emissions blend after undergoing the same foreground extinction by dust in the Galactic disc and/or within the CMZ. Because the near-IR part of the spectrum is dominated by photospheric emission from the background star, while the mid-IR is dominated by thermal emission from the cooler protostellar core, this configuration naturally produces the distinct extinction estimates A*K and  obtained from the near-and mid-IR spectral regions, respectively. The absence of H2O and Class I CH3OH maser emission towards nearly all sources (Appendix D) is consistent with the early, envelope-dominated evolutionary stage required for this backlighting geometry.
The middle and bottom panels in Figure 4 show the H2O column density from the 3 μm band plotted against the foreground extinction estimates. Of the 23 targets in our sample, eight exhibit strong H2O ice absorption with N(solid H2O) > 2 × 1018 cm−2, while six show moderate absorption (1-2 × 1018 cm−2). The remaining sources display only weak features or yield upper limits. No clear correlation is found between N(solid H2O) and the YSO classifications of An et al. (2011, see Table 1): for example, two OH/IR stars (SSTGC 619964 and SSTGC 696367) show significant detections, whereas another star known in the literature has only an upper limit. As is discussed further below, in the context of near-/mid-IR source superposition, the near-IR classifications of these sources as (super-)giants do not necessarily preclude them from being YSOs.
For sources with significant detections of H2O ice, the measured optical depths are τ3.0 ≈ 0.5-4.0. A minor contribution could arise from intervening Galactic disc clouds, but this effect is expected to be negligible, with Moultaka et al. (2015) finding τ3.0 ≈ 0.03 towards stars in the vicinity of Sgr A*. Even if this full amount were present along our sightlines, it would account for only ~6% of the weakest detection and <1% of the strongest. We therefore consider the foreground H2O ice absorption negligible and apply no correction.
For comparison, the solid lines in Fig. 4 show the empirical relation for Taurus derived by Whittet et al. (2001), who found that H2O ice appears in dense clouds once the extinction exceeds AK ≈ 0.35 mag (see also Whittet et al. 2011). Since the CMZ sightlines include foreground diffuse ISM clouds contributing AK ~ 2.2 mag (AV ~ 20 mag), we shifted the Taurus relation horizontally by this amount. The shifted curve thus reflects the extinction-ice column density relation expected for CMZ sources. However, the shifted Taurus relation provides a poor match to either of the observed distributions. In the middle panel of Fig. 4, most objects with detected H2O ice (open circles) lie above the N(solid H2O) values predicted from their  . In the bottom panel, A*K extends to much higher values, emphasising the exceptionally large extinctions along the near-IR path. The Whittet et al. relation lies between the two distributions defined by
  and A*K, indicating that a single Taurus-like relation does not adequately describe our CMZ sample. This is not surprising, since CMZ sightlines are considerably more complex than those in nearby molecular clouds, as is illustrated by the following effects:
The threshold extinction for the onset of H2O ice formation is not consistently reproduced by either
 or A*K. In the middle panel, sources with upper limits in N(solid H2O) broadly define a CMZ threshold near
  ≈ 2.55 at the minimum detected N(solid H2O), yet one object (SSTGC 653270) already shows substantial ice at this value. In the bottom panel, the apparent threshold in A*K is nearly twice as large. This behaviour is naturally explained by the highly patchy foreground extinction towards the CMZ, which varies on ~ 1′ scales and shifts the effective extinction at which ice appears along a given line of sight.
Even where the threshold extinction appears roughly consistent in the middle panel, the shifted Taurus relation still fails to reproduce the observed
 -N(solid H2O) distribution. Nearly half of the sources lie above the Taurus prediction in N(solid H2O) at a given
  , which would imply either that
  underestimates the relevant dust column or that H2O ices form more efficiently in the CMZ than in Taurus. The latter scenario seems unlikely in the strongly UV-irradiated, warmer CMZ environment, suggesting instead that
  does not trace the same column of cold dust that dominates the ice absorption.
Despite the measurement uncertainties, an overall increase in N(solid H2O) with A*K is evident in the bottom panel. Some of the scatter may again be driven by patchy foreground extinction. However, because our N(solid H2O) estimates are mainly constrained by the near-IR 3 μm ice band, while the librational band provides only a weak additional constraint, N (solid H2O) is expected to correlate more tightly with A*K than with
 , in agreement with the observed trend.
This behaviour reflects the different optical paths that define
 and A*K through the same YSO envelope (Fig. 5): the mid-IR path (
 , middle panel) samples a shorter route through warmer, more deeply embedded regions, whereas the near-IR path (A*K, bottom panel) traverses cooler, more extended parts of the envelope. If A*K and
  therefore probe different dust columns, then thermal processing of ices and radial gradients in ice abundance within the envelope naturally lead to departures from a simple, single-column Taurus-like dust-N(solid H2O) relation.
Estimates on foreground extinction and H2O ice absorption.
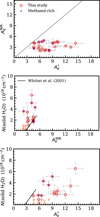 |
Fig. 4 Distribution of extinction and H2O ice column densities derived from the global fits to the composite spectra. The two extinction estimates, |


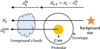 |
Fig. 5 Schematic illustration of the light-ray geometry probed by the composite spectra. A*K reflects extinction constrained mainly by the near-IR, while |


4.2 Column densities of solid CH3 OH
In addition to the SED fitting, we analysed the 3.535 μm absorption feature from solid CH3OH (Hudgins et al. 1993; Schutte et al. 1996). The band is sufficiently narrow that the local continuum was fitted with a third-order polynomial over the 3.40-3.50 μm and 3.60-3.70 μm intervals. The feature was modelled in optical-depth space with the laboratory spectrum of pure CH3OH ice at 10 K (Hudson et al. 2024), fitted using the curve_fit routine from the SciPy library. As it lies on the long-wavelength wing of a stronger, broader band centred at 3.42 μm, it was extracted using the same polynomial fit and wavelength ranges adopted for the optical-depth spectra. The model spectrum was then smoothed to match the spectral resolution of our observations.
Table 4 summarises the peak optical depth of the 3.535 μm absorption in the best-fit model (τ3.535) for both the Gem-ini/GNIRS and IRTF/SpeX samples. The column density N(solid CH3OH) was computed using a band strength of 5.19 × 10⁻¹⁸ cm molecule−1 (Hudson et al. 2024). The value is close to 5.3 × 10⁻¹⁸ cmmolecule−1 in Hudgins et al. (1993); however, a conservative 12% uncertainty in the band strength was adopted to account for the impact of the 3.42 μm feature. We further assessed systematic effects by re-fitting the spectra with a second-order polynomial continuum and by modelling the feature with a Gaussian profile to evaluate model dependence in τ3.535. The uncertainties listed in Table 4 are the quadrature sum of these contributions and the statistical errors derived from the covariance matrix of the fit. Upper limits are quoted at the 3σ level, calculated from the total error budget.
Of the targets with repeated observations, only SSTGC 696367 exhibits a significant detection of the 3.535 μm band, and its individual τ3.535 measurements are consistent within the statistical uncertainty. The three objects (SSTGC 653270, SSTGC 696367, and SSTGC 726327) with significant detections were also included in Jang et al. (2022); the differences in τ3.535 are well within the measurement uncertainties (< 0.01). Since the comparison for SSTGC 653270 and SSTGC 696367 was made based on independent observations, it demonstrates the robustness of our τ3.535 estimates. In case of SSTGC 726327, the IRTF/SpeX spectra have been re-analysed in this work, which also yields a result consistent with the previously reported value of 0.10 ± 0.01 in An et al. (2017).
Figure 6 shows the optical-depth spectra of objects with detections at >2.5σ significance, including four with >3σ confidence. Spectra of the remaining objects are presented in Appendix B. The red shading denotes the ±1σ range of the total uncertainty. Among these six objects, SSTGC 726327 and SSTGC 817031 have previously been reported to show CH3OH (Jang et al. 2022), while the 3.535 μm detections for the remaining four objects are new from this work. As is noted above for H2O ice, the detection of CH3OH ice is not correlated with the mid-IR classifications in An et al. (2011): for example, the previously known stars (SSTGC 696367 and SSTGC 817031) exhibit moderate to significant detections.
Figure 7 shows N(solid CH3OH) plotted against our foreground extinction measurements:  in the top panel and A*K in the middle panel. As for water ice in Fig. 4, N(solid CH3 OH) measurements show a large upward scatter above the local relation with respect to
  (top panel). The scatter of N(solid CH3OH) is more pronounced against A*K (middle panel). For reference, the local relation from Whittet et al. (2011) is shown as a solid line, shifted by AK = 2.2 mag to account for the extinction of the foreground diffuse clouds in front of the CMZ. Methanol ice tends to form in denser regions and deeper layers of clouds, where the extinction is generally higher than in the environments where H2 O ice forms. Thus, the extinction threshold for detecting CH3OH ice (AK ≈ 1.87 ± 0.50) is higher than that for water ice (see Boogert et al. 2011). However, the threshold extinction of N(solid CH3 OH) in the top panel is less apparent than that for water ice in Fig. 4.
In the bottom panel of Fig. 7, N(solid CH3OH) is shown against N(solid H2O). The absence of a clear correlation reflects the significant scatter observed in the top and middle panels. Nevertheless, in local clouds, both N(solid H2O) and N (solid CH3OH) typically increase with extinction (Boogert et al. 2011), suggesting higher N (solid CH3OH) at higher N (solid H2O). Therefore, the lack of a positive trend in our sample, particularly considering upper limits in these measurements, may indicate that the ice abundances have been modified by environmental effects, such as thermal processing within YSO envelopes. These possibilities and their implications for ice chemistry in the CMZ are explored in the following section.
Peak optical depths and column densities of solid CH3OH.
4.3 Mixing ratio of CH3 OH and CO2
The primary feature distinguishing our sample objects from the other CMZ sources is the strong, broad 15 μm absorption from CO2 ice. As is described in Sect. 1, CH3 OH-rich CO2 ice grains are responsible for the long-wavelength shoulder of this absorption band. The greater shoulder absorption compared to the polar (H2 O-rich) and apolar (CO-rich) components of CO2 ice is uniquely seen towards massive YSOs in the CMZ, suggesting that distinct chemical networks operate in CMZ star-forming clouds, producing unique chemical mixtures.
The upper left panel of Figure 8 shows N(solid CH3 OH) plotted against the CO2 shoulder column densities from An et al. (2011) for all 23 objects in our CMZ sample, with red circles indicating detections and arrows marking 3σ upper limits. The ratio of these quantities represents the CH3OH:CO2 mixing ratio in ice grains, spanning 0.7-5.9 for the six objects with useful 3.535 μm detections (>2.5σ). A linear fit to the CMZ detections (excluding upper limits) yields a slope of N(solidCH3OH)/N(CO2 shoulder) = 3.3 ± 0.7 (dashed line), consistent with 2.9 ± 0.6 reported by Jang et al. (2022). For comparison, the upper right panel shows measurements for YSOs in the Galactic disc (Boogert et al. 2008; Pontoppidan et al. 2008), which span a broader range (1.3-52.2) and have a mean ratio of 12.8 ± 2.4 (dashed line), significantly higher than the CMZ value. This contrast is also evident in the lower panels, where individual probability density functions (thin lines) are modelled as bivariate normal distributions using the measured column densities and their 1σ uncertainties; their sum (thick line) represents the overall distribution.
According to the LIDA laboratory experiment of CO2 ice absorptions (Ehrenfreund et al. 1999), even a relatively low abundance of CH3OH in CH3OH:CO2 mixtures can produce the shoulder absorption of solid CO2 centred at 15.4 μm at temperatures below 130 K. The band strength extracted from the laboratory data is nearly the same as in more methanol-rich mixtures, such as those appropriate for the Galactic disc population. On the other hand, the shoulder component could also arise in mixtures with species other than CH3 OH. In that case, the presence of additional species would enhance the strength of the 15.4 μm shoulder, while N(solid CH3OH) would remain unchanged because the 3.535 μm band originates primarily from CH3OH. Thus, if other species that act as bases in Lewis acid-base interactions, such as ethanol or related molecules, contribute to the CO2 shoulder (e.g. Dartois et al. 1999), the inferred CH3OH:CO2 ratio would decrease, since part of the 15.4 μm absorption would not be due to CH3OH. Such a scenario would make the CMZ objects distinct from those in the Galactic disc, but only if the CMZ uniquely hosts a large reservoir of these more complex molecules.
If the 15.4 μm shoulder arises entirely from CO2 ice mixed with CH3OH, the relatively low abundance ratios shown in Fig. 8 may point to a distinctive chemical environment in the CMZ. In particular, they could suggest that CH3 OH formation is less efficient relative to CO2 in CMZ clouds, even though both species are produced through CO reactions involving hydrogenation or oxidation (see Jang et al. 2022). However, the CH3OH:CO2 mixing ratio in the CMZ displays substantial scatter. Among the six CMZ sources with significant detections, SSTGC 817031 shows the highest ratio (~27.7), whereas SSTGC 719445 has the lowest (~2.1). Including upper limits for the other 17 objects broadens the range even further, implying large variations across the sample. Such a wide spread in abundance ratios would imply a high level of chemical diversity among clouds in the CMZ.
Instead, we argue in the next section that the observed scatter primarily reflects variations in the lines of sight, with each spectrum probing different regions of the YSO envelope. This geometry offers a rare opportunity to investigate the internal chemical structure of CMZ YSOs: CO2 absorption is measured from mid-IR spectra, whereas N(solid CH3OH) is derived from near-IR data. By contrast, the consistently higher abundance ratios found for YSOs in the Galactic disc may stem from tracing the same mid-IR sightlines. In that case, N(solid CH3 OH) estimates were based on the 9.7 μm C-O stretching mode (Skinner et al. 1992) in the same mid-IR spectra (Pontoppidan et al. 2008). We revisited this feature in our own data in Appendix C, but the CMZ sources are considerably fainter, leading to much lower S/N at the bottom of the deep 9.7 μm silicate bands.
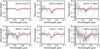 |
Fig. 6 Optical depth spectra of CMZ sources exhibiting 3.535 μm solid CH3OH absorption at >2.5σ significance. The red line shows the best-fit model for pure solid CH3OH ice, and the shaded area denotes the ±1σ confidence interval. Spectra for the remaining sources are provided in Appendix B. |
5 Ensemble average of CMZ YSOs
5.1 Reduced foreground extinction
Our CMZ objects appear as point-like sources in Spitzer/IRAC mid-IR images (FWHM ~2"). At a distance of 8.3 kpc to the Galactic centre (Reid et al. 2014), this corresponds to ≲8300 au in projection, implying that the near-IR sightlines towards the background giant through the YSO envelope are unresolved within this scale and can be regarded as the near-IR counterparts of the mid-IR sources. Consequently, the projected separation between each near-IR sightline and the YSO centre cannot be directly measured. As an alternative, foreground extinction can serve as a proxy for projected separation, as the integrated dust column density within the YSO envelope generally increases towards its centre. However, the complex nature of foreground extinction fields of the CMZ - arising from patchy extinction in intervening Galactic disc clouds, additional obscuration by CMZ clouds, and dust within the YSO envelope - means that such an approach requires a careful understanding of the foreground dust properties.
In order to isolate the extinction contributed by a YSO envelope from the rest of the foreground extinction, we defined a reduced extinction as
 (1)
(1)
where  is the mean foreground extinction from dust lying between the Sun and the YSO’s outer surface. Since A*K measures the total AK from the Sun to the background giant, subtracting
  yields a reduced AK that more closely represents the extinction through the YSO envelope alone. For
  , we adopted the foreground extinction estimates from An et al. (2013), who measured the depth of the 9.7 μm silicate feature in spectra of the diffuse ISM, deliberately selected to exclude point sources. For most of our sample, such measurements are available at four orthogonal positions, each located approximately 1′ (equivalent to 2.4 pc in projection) from the target. We averaged the AK values converted from the silicate depths and incorporated their standard deviation into the total
  uncertainty budget. These results are listed in the second and third columns of Table 5.
Alternatively, the fourth column of Table 5 shows the differential extinction, obtained by subtracting the foreground extinction (second column) from the mid-IR extinction  . Although
  does not trace the column density towards a background giant but rather probes the line of sight into the YSO itself, one might expect that subtracting the foreground ISM extinction from the total mid-IR extinction would yield a positive residual, corresponding to the local envelope material. The presence of prominent mid-IR absorption features, such as the 15 μm CO2 band, supports this expectation. However, even in sources that exhibit significant CH3OH ice absorption, the residual extinction listed in the fourth column often appears consistent with zero or even slightly negative values. This result does not contradict the observed mid-IR absorption but rather reflects the limitations imposed by the measurement uncertainties.
Figure 9 shows the column densities of H2O and CH3OH ices as a function of  . As in the case of A*K (Fig. 4), N(solid H2O) increases with extinction (Pearson’s correlation coefficient of r = 0.565), but the zero-point shift in
  lowers the minimum extinction to ~1 mag. The decline of N(solid CH3OH) with
  closely parallels that with A*K (Fig. 7), although the trend is less significant than in the H2O case (r = −0.367). Interpreting
  as a proxy for projected distance from the source centre, these trends suggest that N(solid H2O) rises and N(solid CH3OH) falls towards the source centre. The linear fits yield dispersions of ∆N = 1.2cm−2 and 1.8 cm−2 in the top and bottom panels, respectively, close to the expected uncertainties of 1.0 cm−2 and 1.4 cm−2. The small excess may reflect intrinsic variations in ice abundances due to differing temperature structures among YSOs of varying masses or evolutionary stages.
Nonetheless,  extends from ~1 mag to nearly 12 mag, indicating a wide range of dust column densities along the various lines of sight in our sample. To assess whether dust extinction can be quantitatively linked to the projected distance from the source centre, we constructed a spherically symmetric gas model representing the envelope in the early phase of YSO evolution. Assuming a density power-law index of 1.5 (e.g. Jørgensen et al. 2002) and a total mass of 10-20 M⊙ for our CMZ YSOs, as is inferred from multi-wavelength SED fitting (An et al. 2011), and adopting the gas-to-dust ratio from Bohlin et al. (1978), we estimated that the dust extinction through the envelope is 4 ≲ AK ≲ 8 mag at 1" from the centre. At 0.5″, the extinction increases to 6 ≲ AK ≲ 11 mag. This range of AK is broadly consistent with
  in Fig. 9, supporting the view that our observed near-IR sightlines probe different regions of the extended envelopes of the CMZ YSOs.
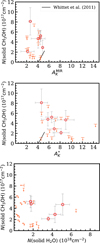 |
Fig. 7 Methanol-ice column densities against foreground extinction estimates ( |

Reduced foreground extinction.
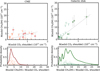 |
Fig. 8 Mixing ratios of CH3OH ice to the shoulder component of CO2 ice. Circles and arrows in the top panels indicate measurements and 3σ upper limits, respectively, for the red CMZ objects in this study (left) and for YSOs in the Galactic disc (Pontoppidan et al. 2008, right). In the bottom two panels, probability density functions of the mixing ratio N(solidCH3OH)/N(CO2 shoulder) are shown for the CMZ and disc YSOs, respectively. Thin lines correspond to individual measurements, assuming a bivariate normal distribution for the measured column densities and their 1sgr; uncertainties; the thick line shows the sum of all distributions. |
5.2 Average chemical structure of YSOs
The top panel of Figure 10 shows the fractional abundance of CH3OH ice, defined as N(solid CH3OH) divided by N (solid H2O), for sources in our sample. The ratios are shown as a function of reduced extinction  , which serves here as a proxy for the projected distance from the source centre. The ratio peaks at ~0.3 near
  ≈ 2 mag, but generally stays below 0.1 for
  > 3 mag. To highlight the overall trend, the thick red line represents the weighted mean abundance ratio in four adaptive extinction intervals, including the single upper limit at
  ~ 1 mag. When viewed as an ensemble, the CMZ objects show a trend in which a typical CMZ YSO exhibits a sharp rise in methanol ice abundance in the outer envelope, while the abundance remains low (< 0.1) in the inner region.
For comparison, the thick blue line in the top panel of Fig. 10 shows the methanol abundance profile towards SMM 4, a nearby, well-characterised low-mass Class 0 YSO projected against the young cluster SVS 4 (Pontoppidan et al. 2004). To construct this profile, we used their ice abundance measurements, which include H2O column densities along ten sightlines towards background stars spanning projected distances of ~4500-19000 au from the centre of SMM 4. The H2O abundance relative to H2 was found to be nearly constant across most of this range, except for a single data point at ~4700 AU that showed a significantly higher abundance. CH3OH ice was detected in four sightlines within ~ 12 000 au, and the inferred abundance remained nearly constant across these positions, with a strong upper limit placed at the outermost radius (~ 19 000 au). In constructing the CH3OH/H2O ratio profile, we adopted their abundance values and assumed a constant CH3OH abundance inwards of the innermost detection, based on their best-fitting envelope model. This results in a broad peak in the CH3OH/H2O ratio at intermediate radii, caused by the combination of flat CH3OH abundance and a centrally increasing H2O abundance.
As in SMM 4, the CH3OH abundance of the CMZ ensemble exhibits a peak at intermediate radii within the envelope. In the cold and less dense outer envelope, methanol formation is suppressed due to the reduced efficiency of CO hydrogenation, likely caused by the limited mobility and availability of atomic hydrogen at low temperatures (e.g. Watanabe et al. 2003). While water ice can still accumulate in these conditions, methanol production becomes less efficient, leading to a declining N(solid CH3OH)/N(solid H2O) ratio with increasing distance from the source centre.
The peak CH3OH abundance in the CMZ ensemble (≈0.3) is comparable to that observed towards SMM 4, suggesting that methanol formation via CO hydrogenation on grain surfaces may impose a common upper limit on CH3OH ice production in starforming cores. However, the abundance peak in the CMZ sources spans a narrower AK range than in SMM 4, potentially reflecting their higher total masses (~10-20 M⊙; An et al. 2011) compared to ~5.8 M⊙ for SMM 4 (Pontoppidan et al. 2004). The shorter evolutionary timescales of high-mass YSOs likely result in hotter internal structures, which in turn enhance CH3OH ice sublimation in the inner envelope. As a consequence, methanol ice is efficiently thermally desorbed near the protostar, producing a characteristic abundance peak at intermediate depths.
This interpretation can further explain the observed low N(solidCH3OH)/N(CO2 shoulder) values of CMZ YSOs (Fig. 8). The bottom panel of Fig. 10 shows the trend of N(solid CH3OH) relative to the CO2 shoulder component, with the ratio peaking at lower  (i.e. in the outer envelope regions) and gradually decreasing towards higher
  (i.e. the warmer, inner regions of the YSOs). The declining ratio with increasing
  suggests that CH3OH is more efficiently depleted than CO2 from the ice mantles in the inner envelopes. This trend is somewhat counter-intuitive, given the higher sublimation temperature of CH3 OH compared to CO2. However, CH3OH may be efficiently destroyed or chemically transformed into more complex organic species as the ices are subjected to UV irradiation followed by thermal processing. UV photons dissociate CH3OH into radicals, which then become mobile and recombine during warm-up to form complex molecules. This combined processing reduces the CH3OH abundance relative to CO2, which is more photo-stable and less reactive under similar conditions (e.g. Gerakines et al. 1996; Öberg et al. 2009). In addition, desorption driven by increasing gas temperature may remove both CO2 and CH3 OH; however, CH3OH may appear preferentially depleted, as it is a minor component in the ice mixture. In contrast, CO2 is more abundant and remains detectable through its prominent 15.4 μm shoulder feature.
Previously, Jang et al. (2022) proposed that the reduced CH3 OH abundance could result from elevated oxygen abundance in the CMZ, which favours oxidation of CO over hydrogenation, thereby limiting CH3OH production. However, the present result suggests that the lower methanol ice abundance may not directly arise from suppressed CH3OH formation pathways. Instead, it may reflect a sample bias towards higher-mass YSOs, in which methanol ice has been more significantly depleted.
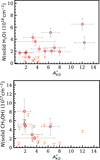 |
Fig. 9 Column densities of H2O ice (top) and CH3OH ice (bottom) as a function of reduced extinction, |


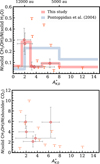 |
Fig. 10 Relative abundance of CH3 OH ice in the CMZ sources, shown with respect to H2O ice (top panel) and to the CO2 shoulder component (bottom panel), as a function of reduced extinction |

6 Summary
We have presented a spectroscopic study of 23 extremely red, point-like CMZ sources, combining new L-band data from Gem-ini/GNIRS (15 objects) with previously published IRTF/SpeX L-band data (8 objects), and supplementing these with archival Spitzer/IRS spectra to trace ice chemistry and foreground attenuation from 2 to 35 μm. Many targets show K-band CO band heads consistent with (super-)giant photospheres, while their mid-IR continua and strong ice bands are characteristic of embedded YSOs (An et al. 2017; Jang et al. 2022). This supports a backlighting geometry in which a background giant star illuminates a foreground YSO envelope (or dense core), enabling us to probe the envelope material through absorption features. We modelled each composite SED and derived both near- and mid-IR extinction estimates, along with robust ice column densities.
Water ice absorption is strong and ubiquitous among our sources, with N(solid H2O) ~ (0.1-6.5) × 1019 cm−2. The mid-IR extinction ( ) is typically 2-5 mag, whereas the extinction towards the background star (A*K) spans 4-15 mag, with A*K systematically exceeding
  at fixed N(solid H2O). This offset is consistent with the background star being behind additional envelope material. Solid CH3OH is detected at > 2.5σ towards six objects; in the remainder we report meaningful upper limits.
To compare N(solid CH3OH) measured in the near-IR with the CO2:CH3OH mixtures traced in the mid-IR (An et al. 2009, 2011), we revisited the 15.4 μm CO2 ‘shoulder’ component. In the CMZ, the bulk ratio N(CH3OH)/N(CO2 shoulder) is ~2-5%, with a mean of 3.3 ± 0.7%, confirming earlier findings (Jang et al. 2022) that it is systematically lower than typical Galactic disc values (5-15%). This indicates either intrinsically reduced CH3OH production or preferential depletion (or processing) of CH3OH in CMZ envelopes. Exploiting the backlighting geometry, we introduced a reduced extinction ( ) as a proxy for projected distance through an envelope. In this ensemble framework, N(CO2 shoulder) increases with
  , while N (solid CH3OH) shows a declining trend; the ice abundance ratio CH3OH/CO2 is ~10% in inner lines of sight (large
  ) and rises steeply to ~30% in the outer envelope (small
  ). As our CMZ sample is likely biased towards more massive YSOs, the trends suggest that internal heating preferentially sublimates and/or chemically alters CH3 OH relative to CO2 in the inner envelope, lowering the line-of-sight CH3OH/CO2 while leaving high methanol abundances in the outer regions. This thermal/UV processing scenario offers an alternative to purely chemicalnetwork explanations (e.g. distinct elemental ratios in the ISM) for the CMZ’s low integrated CH3OH/CO2 ratios.
Our results demonstrate that (i) red CMZ point sources often comprise superposed near- and mid-IR components; (ii) joint modelling of near- and mid-IR spectra enables an estimate of the foreground extinction towards the backlit giant and thus the line-of-sight integrated column through the YSO envelope; and (iii) backlit spectroscopy can reveal ensemble-averaged radial abundance trends that would otherwise be inaccessible at the distance of the CMZ. Our conclusions are tempered by systematic uncertainties in cross-instrument flux scaling and by crowding and/or background-subtraction effects; moreover, a limited S/N at the base of the 9.7 μm silicate band precludes robust use of the CH3OH C-O stretching mode. High-S/N, higher-resolution mid-IR spectroscopy and spatially resolved mapping (e.g. with JWST) of additional backlit sightlines will enable tests of the inferred abundance gradients and quantify the roles of sublimation, photochemistry, and mixing in setting the distinct ice chemistry of CMZ YSOs.
Acknowledgements
We thank the anonymous referee for constructive comments that helped improve the clarity and presentation of this manuscript. D.A. thanks Kris Sellgren and Solange Ramírez for their advice and support in the preparation of the Gemini observations. D.A. acknowledges the hospitality and support provided by the staff at the Gemini Observatory’s Hilo office during a research visit in 2017, which contributed to the development of this work. D.A. also thanks Minjin Kim for his assistance with the data acquisition during that visit. Y.K. and D.A. are grateful to Young-Jun Kim for discussions on YSO modelling. We acknowledge support provided by the National Research Foundation (NRF) of Korea grant funded by the Ministry of Science and ICT (RS-2021-NR058093). Based on observations obtained at the international Gemini Observatory, a programme of NSF NOIRLab, which is managed by the Association of Universities for Research in Astronomy (AURA) under a cooperative agreement with the U.S. National Science Foundation on behalf of the Gemini Observatory partnership: the U.S. National Science Foundation (United States), National Research Council (Canada), Agencia Nacional de Investigación y Desarrollo (Chile), Ministerio de Ciencia, Tecnología e Innovación (Argentina), Ministério da Ciência, Tecnologia, Inovações e Comu-nicações (Brazil), and Korea Astronomy and Space Science Institute (Republic of Korea). This work was enabled by observations made from the Gemini North telescope, located within the Maunakea Science Reserve and adjacent to the summit of Maunakea. We are grateful for the privilege of observing the Universe from a place that is unique in both its astronomical quality and its cultural significance. NOIRLab IRAF is distributed by the Community Science and Data Center at NSF NOIRLab, which is managed by the Association of Universities for Research in Astronomy (AURA) under a cooperative agreement with the U.S. National Science Foundation.
References
- An, D., Ramírez, S. V., Sellgren, K., et al. 2009, ApJ, 702, L128 [Google Scholar]
- An, D., Ramírez, S. V., Sellgren, K., et al. 2011, ApJ, 736, 133 [Google Scholar]
- An, D., Ramírez, S. V., & Sellgren, K. 2013, ApJS, 206, 20 [Google Scholar]
- An, D., Sellgren, K., Boogert, A. C. A., et al. 2017, ApJ, 843, L36 [Google Scholar]
- Andre, P., Ward-Thompson, D., & Barsony, M. 1993, ApJ, 406, 122 [NASA ADS] [CrossRef] [Google Scholar]
- Bohlin, R. C., Savage, B. D., & Drake, J. F. 1978, ApJ, 224, 132 [Google Scholar]
- Boogert, A. C. A., Pontoppidan, K. M., Knez, C., et al. 2008, ApJ, 678, 2, 985 [Google Scholar]
- Boogert, A. C. A., Huard, T. L., Cook, A. M., et al. 2011, ApJ, 729, 92 [NASA ADS] [CrossRef] [Google Scholar]
- Boogert, A. C. A., Gerakines, P. A., & Whittet, D. C. B. 2015, ARA&A, 53, 541 [Google Scholar]
- Boogert, A. C. A., Brewer, K., Brittain, A., et al. 2022, ApJ, 941, 32 [NASA ADS] [CrossRef] [Google Scholar]
- Caswell, J. L., Fuller, G. A., Green, J. A., et al. 2010, MNRAS, 404, 1029 [Google Scholar]
- Chiar, J. E., Adamson, A. J., Kerr, T. H., et al. 1995, ApJ, 455, 234 [NASA ADS] [CrossRef] [Google Scholar]
- Chiar, J. E., Pendleton, Y. J., Allamandola, L. J., et al. 2011, ApJ, 731, 9 [NASA ADS] [CrossRef] [Google Scholar]
- Crowe, S., Fedriani, R., Tan, J. C., et al. 2025, ApJ, 983, 19 [Google Scholar]
- Cuppen, H. M., van Dishoeck, E. F., Herbst, E., & Tielens, A. G. G. M. 2009, A&A, 508, 275 [NASA ADS] [CrossRef] [EDP Sciences] [Google Scholar]
- Cushing, M. C., Vacca, W. D., & Rayner, J. T. 2004, PASP, 116, 362 [NASA ADS] [CrossRef] [Google Scholar]
- Dartois, E., Demyk, K., d’Hendecourt, L., et al. 1999, A&A, 351, 1066 [Google Scholar]
- Dong, H., Wang, Q. D., & Morris, M. R. 2012, MNRAS, 425, 884 [Google Scholar]
- Ellingsen, S. P. 2006, ApJ, 638, 241 [Google Scholar]
- Ehrenfreund, P., Kerkhof, O., Schutte, W. A., et al. 1999, A&A, 350, 240 [NASA ADS] [Google Scholar]
- Elias, J. H., Joyce, R. R., Liang, M., et al. 2006a, Proc. SPIE, 6269, 62694C [CrossRef] [Google Scholar]
- Elias, J. H., Rodgers, B., Joyce, R. R., et al. 2006b, Proc. SPIE, 6269, 626914 [CrossRef] [Google Scholar]
- Fitzpatrick, M., Placco, V., Bolton, A., et al. 2024, arXiv e-prints [arXiv:2401.01982] [Google Scholar]
- Fontani, F., Cesaroni, R., & Furuya, R. S. 2010, A&A, 517, A56 [NASA ADS] [CrossRef] [EDP Sciences] [Google Scholar]
- Fritz, T. K., Gillessen, S., Dodds-Eden, K., Lutz, D., Genzel, R., et al. 2011, ApJ, 737, 73 [Google Scholar]
- Gaume, R. A., Claussen, M. J., de Pree, C. G., et al. 1995, ApJ, 449, 663 [Google Scholar]
- Gerakines, P. A., Schutte, W. A., & Ehrenfreund, P. 1996, A&A, 312, 289 [NASA ADS] [Google Scholar]
- Gerakines, P. A., Whittet, D. C. B., Ehrenfreund, P., et al. 1999, ApJ, 522, 357 [NASA ADS] [CrossRef] [Google Scholar]
- Ginsburg, A., Bally, J., Barnes, A., et al. 2018, ApJ, 853, 2, 171 [Google Scholar]
- Hagen, W., Tielens, A. G. G. M., & Greenberg, J. M. 1981, Chem. Phys., 56, 367 [NASA ADS] [CrossRef] [Google Scholar]
- Hatchell, J., & Fuller, G. A. 2008, A&A, 482, 3, 855 [Google Scholar]
- Heyer, M., Gutermuth, R., Urquhart, J. S., et al. 2016, A&A, 588, A29 [NASA ADS] [CrossRef] [EDP Sciences] [Google Scholar]
- Hudgins, D. M., Sandford, S. A., Allamandola, L. J., & Tielens, A. G. G. M. 1993, ApJS, 86, 713 [NASA ADS] [CrossRef] [Google Scholar]
- Hudson, R. L., Gerakines, P. A., & Yarnall, Y. Y. 2024, ApJ, 970, 108 [Google Scholar]
- Indebetouw, R., Mathis, J. S., Babler, B. L., et al. 2005, ApJ, 619, 931 [NASA ADS] [CrossRef] [Google Scholar]
- Jang, D., An, D., Sellgren, K., et al. 2022, ApJ, 930, 16 [Google Scholar]
- Jørgensen, J. K., Schöier, F. L., & van Dishoeck, E. F. 2002, A&A, 389, 908 [CrossRef] [EDP Sciences] [Google Scholar]
- Kemper, F., Vriend, W. J., & Tielens, A. G. G. M. 2004, ApJ, 609, 826 [Google Scholar]
- Kim, K.-T., Byun, D.-Y., Je, D.-H., et al. 2011, J. Korean Astron. Soc., 44, 81 [NASA ADS] [CrossRef] [Google Scholar]
- Kim, C.-H., Kim, K.-T., & Park, Y.-S. 2018, ApJS, 236, 31 [NASA ADS] [CrossRef] [Google Scholar]
- Kim, W.-J., Kim, K.-T., & Kim, K.-T. 2019, ApJS, 244, 2 [NASA ADS] [CrossRef] [Google Scholar]
- Lada, C. J. 1987, Star Forming Regions, 115, 1 [NASA ADS] [Google Scholar]
- Lee, S.-S., Byun, D.-Y., Oh, C. S., et al. 2011, PASP, 123, 1398 [NASA ADS] [CrossRef] [Google Scholar]
- Lindqvist, M., Winnberg, A., Habing, H. J., et al. 1992, A&AS, 92, 43 [Google Scholar]
- Longmore, S. N., Walsh, A. J., Purcell, C. R., et al. 2017, MNRAS, 470, 1462 [Google Scholar]
- Lucas, P. W., Hoare, M. G., Longmore, A., et al. 2008, MNRAS, 391, 136 [Google Scholar]
- Madden, M. C. L., Boogert, A. C. A., Chiar, J. E., et al. 2022, ApJ, 930, 2 [NASA ADS] [CrossRef] [Google Scholar]
- Mauerhan, J. C., Muno, M. P., Morris, M. R., et al. 2010, ApJ, 710, 706 [Google Scholar]
- Meng, F., Sánchez-Monge, Á., Schilke, P., et al. 2019, A&A, 630, A73 [NASA ADS] [CrossRef] [EDP Sciences] [Google Scholar]
- Meng, F., Sánchez-Monge, Á., Schilke, P., et al. 2022, A&A, 666, A31 [NASA ADS] [CrossRef] [EDP Sciences] [Google Scholar]
- Menten, K. M. 1991, ApJ, 380, L75 [Google Scholar]
- Moultaka, J., Eckart, A., & Mužić, K. 2015, ApJ, 806, 202 [NASA ADS] [CrossRef] [Google Scholar]
- Öberg, K. I., Boogert, A. C. A., Pontoppidan, K. M., et al. 2011, ApJ, 740, 109 [Google Scholar]
- Öberg, K. I., Garrod, R. T., van Dishoeck, E. F., et al. 2009, A&A, 504, 891 [NASA ADS] [CrossRef] [EDP Sciences] [Google Scholar]
- Pontoppidan, K.M., van Dishoeck, E.F., & Dartois, E. 2004, A&A, 426, 925 [NASA ADS] [CrossRef] [EDP Sciences] [Google Scholar]
- Pontoppidan, K. M., Boogert, A. C. A., Fraser, H. J., et al. 2008, ApJ, 678, 1005 [NASA ADS] [CrossRef] [Google Scholar]
- Ramírez, S. V., Arendt, R. G., Sellgren, K., et al. 2008, ApJS, 175, 147 [Google Scholar]
- Rayner, J. T., Toomey, D. W., Onaka, P. M., et al. 2003, PASP, 115, 362 [NASA ADS] [CrossRef] [Google Scholar]
- Rayner, J. T., Cushing, M. C., & Vacca, W. D. 2009, ApJS, 185, 289 [Google Scholar]
- Reid, M. J., Menten, K. M., Brunthaler, A., et al. 2014, ApJ, 783, 130 [Google Scholar]
- Rocha, W. R. M., Rachid, M. G., Olsthoorn, B., et al. 2022, A&A, 668, A63 [NASA ADS] [CrossRef] [EDP Sciences] [Google Scholar]
- Roche, P. F., & Aitken, D. K. 1984, MNRAS, 208, 481 [NASA ADS] [Google Scholar]
- Roche, P. F., & Aitken, D. K. 1985, MNRAS, 215, 425 [Google Scholar]
- Savitzky, A., & Golay, M. J. E. 1964, Analyt. Chem., 36, 1627 [NASA ADS] [CrossRef] [Google Scholar]
- Schutte, W. A., Gerakines, P. A., Geballe, T. R., van Dishoeck, E. F., & Greenberg, J. M. 1996, A&A, 309, 633 [NASA ADS] [Google Scholar]
- Skinner, C. J., Tielens, A. G. G. M., Barlow, M. J., et al. 1992, ApJ, 399, L79 [NASA ADS] [CrossRef] [Google Scholar]
- Sridharan, T. K., Beuther, H., Schilke, P., et al. 2002, ApJ, 566, 2, 931 [Google Scholar]
- Tody, D. 1986, Proc. SPIE, 627, 733 [NASA ADS] [CrossRef] [Google Scholar]
- Tody, D. 1993, Astron. Data Anal. Softw. Syst. II, 52, 173 [NASA ADS] [Google Scholar]
- Walker, D. L., Longmore, S. N., Zhang, Q., et al. MNRAS, 474, 2373 [Google Scholar]
- Watanabe, N., Shiraki, T., & Kouchi, A. 2003, ApJ, 588, L121 [Google Scholar]
- Whittet, D. C. B., Gerakines, P. A., Tielens, A. G. G. M., et al. 1998, ApJ, 498, L159 [NASA ADS] [CrossRef] [Google Scholar]
- Whittet, D. C. B., Gerakines, P. A., Hough, J. H., et al. 2001, ApJ, 547, 872 [Google Scholar]
- Whittet, D. C. B., Cook, A. M., Herbst, E., et al. 2011, ApJ, 742, 28 [Google Scholar]
- Yusef-Zadeh, F., Hewitt, J. W., Arendt, R. G., et al. 2009, ApJ, 702, 178 [Google Scholar]
Programme IDs: GN-2017A-Q-28, GN-2022A-Q-118, GN-2022A-Q-217.
NOAO/IRAF version2.16; Gemini/IRAF version1.14. https://www.gemini.edu/observing/phase-iii/reducing-data/gemini-iraf-data-reduction-software
Appendix A Additional spectra of the sample
Figure A.1 presents the full set of observed composite spectra for all sources in our sample. Each panel follows the same format as the top panel of Fig. 3, which illustrates the representative case of SSTGC 799887. The observed data are shown in red, and the coloured curves represent the best-fitting model components as is described in Sect. 4.1, including the stellar continuum, the foreground extinction, and thermal dust emission, as well as major molecular ice absorption features. To avoid strong molecular features and ensure reliable continuum estimation, the model fitting was performed over the following wavelength intervals: 1.90-3.30 μm, 3.65-6.5 μm, 7.8-9.3 μm, 10.2-12.4 μm, 14.0-14.9 μm, 15.8-16.7 μm, 17.8-18.4 μm, 19.0-27.5 μm, and 28.8-30.0 μm. These plots are provided to illustrate the consistency and diversity of spectral shapes across the sample and to complement the parameter values listed in Table 5.
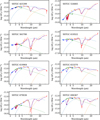 |
Fig. A.1 Spectra of the sample sources (continued). |
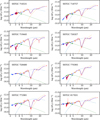 |
Fig. A.1 Spectra of the sample sources (continued). |
Appendix B Additional optical depth spectra centred at 3.53 μm
Figure B.1 presents the remaining set of observed optical depth spectra centred on the 3.535 μm CH3OH band. Each panel follows the same format as Fig. 6, which shows only the sources with significant detections. The observed spectra are shown in grey, and the red curves indicate the best-fitting models described in Sect. 4.2. These plots complement the fitting results listed in Table 4.
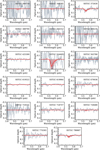 |
Fig. B.1 Same as Fig. 6, but showing the optical-depth spectra of the remaining CMZ sources with non-significant 3.535 μm absorption. |
Appendix C Methanol ice column densities from spectra around 9.7 μm
In addition to the CH3OH ice derived from the 3.535 μm absorption band, we used Spitzer/IRS spectra (An et al. 2011) to measure the peak optical depth and column density of CH3OH ice from the 9.74 μm band. Because the band depth is highly sensitive to the precise shape of the local continuum and the feature lies within the core of the stronger silicate absorption, we adopted a third-order polynomial to define the continuum across the band rather than relying on the global SED silicate profile (Sect. 4.1). The results are listed in Table C.1, with uncertainties that include both statistical errors and systematics, such as those due to continuum placement. Owing to the very strong 10 μm silicate absorption towards our extremely red CMZ sources, the S/N at the band centre is low, and meaningful constraints could be derived for only a few objects.
Figure C.1 presents the optical-depth spectra of the three CMZ objects with significant (> 2.5σ) detections of the 9.74 μm CH3OH absorption. The 3.535 μm measurements (Table 4) show a mild detection for SSTGC 653270, but SSTGC 425399 and SSTGC 770393 exhibit non-detections. The discrepancy between the near-IR (Table 4) and mid-IR (Table C.1) abundances may reflect the low S/N at the bottom of the silicate band affecting the 9.7 μm measurements, or could arise from dual sightlines, with the near- and mid-IR bands tracing different columns along the line of sight.
Peak optical depths and column densities of solid CH3OH from 9.74 μm
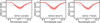 |
Fig. C.1 Optical depth spectra of CMZ objects showing the 9.74 μm absorption feature of CH3OH ice. Only the three sources detected at > 2.5σ are displayed. |
Appendix D Maser observations of the full An et al. (2011) survey sample
We conducted a simultaneous survey of H2O 623 - 523 (22.23508 GHz) and class I CH3OH 70 - 61 A+ (44.06943 GHz) masers towards all 107 sources in June 2011 and April 2012. Observations were carried out with the Korean VLBI Network (KVN) Tamna telescope in single-dish mode (Kim et al. 2011; Lee et al. 2011). The main beam sizes were 130" at 22 GHz and 65" at 44 GHz, with corresponding aperture efficiencies of 0.70 and 0.69. Pointing and focus checks were performed every 2-3 h, with pointing accuracy better than 5". A digital spectrometer backend provided 4096 channels across a 64 MHz bandwidth. All spectra were obtained using position switching. Typical system temperatures were 100-200 K at 22 GHz and 150-350 K at 44 GHz. The on-source integration time was typically 10 min, yielding an rms noise level of ~0.5 Jy at a velocity resolution of 0.2 km s−1. Data were calibrated with the standard chopper-wheel method and placed on the T*A scale. The conversion factors from T*A to flux density were 11.1 Jy K−1 at 22 GHz and 11.6 Jy K−1 at 44 GHz.
We detected H2O maser emission in 7 sources (7%) - SSTGC 304239, 354683, 358370, 360559, 511261, 524665, and 381931 - and CH3OH maser emission in 6 sources (6%) — SSTGC 511261, 524665, 543691, 564417, 536969, and 381931. Three sources (SSTGC 381931, 511261, and 524665) exhibit both water and methanol maser emission. The detection rates are much lower than those reported in previous surveys of high-mass protostellar objects and ultra-compact H II regions; for example, 42% for H2O masers (Sridharan et al. 2002) and 31% for 44 GHz CH3OH masers (Fontani et al. 2010). The detection rates of these two maser species tend to increase as the central objects evolve (Kim et al. 2018; Kim et al. 2019).
No H2O or Class I CH3OH maser emission was detected towards any of the YSOs in our sample except SSTGC 524665, despite their initial classification as massive YSO candidates. H2O masers were detected both in YSOs and evolved stars, while CH3OH masers were predominantly detected towards high-mass YSOs, with Class I masers tracing shocked gas in outflows (Menten 1991; Ellingsen 2006). The almost complete absence of maser emission in our sample therefore suggests that these objects may be less evolved than previously thought - possibly in the deeply embedded Class 0/I stage - or that their masses are overestimated, placing them in a regime where the necessary shock conditions for maser pumping are absent.
Maser Detections from KVN Observation
All Tables
All Figures
|
Fig. 1 GNIRS L-band spectra of 12 red sources in the CMZ. The observed spectra (red) are vertically offset for clarity and approximately ordered by increasing strength of the broad H2O ice absorption band centred at 3 μm. To illustrate the varying depth of this feature, the best-fit IRTF/SpeX M5.5III template spectrum (Rayner et al. 2009) is shown in green for each source. These templates were reddened using the foreground extinction estimate derived from our SED fitting procedure (see Sect. 4.1). Together with the 3 μm ice absorption profile, they reproduce the overall continuum shape and slope of the observed spectra. |
| In the text | |
|
Fig. 2 Same as Figure 1, but for sources that have both K- and L-band spectra from GNIRS observations. |
| In the text | |
|
Fig. 3 Composite IR spectrum of a red CMZ object (SSTGC 799887) and modelling of the SED. The observed spectra are shown as a solid red line, constructed by combining near-IR data from Gemini/GNIRS with mid-IR data from Spitzer/IRS. Circles represent photometric measurements from UKIDSS and Spitzer/IRAC, which were used to set the flux scale of the spectra (see text). The solid blue line shows the best-fitting model to the observed spectra, which included the following components: (1) a template of an M5.5-type giant from the IRTF/SpeX spectral library (Rayner et al. 2009) (green line); (2) a two-component blackbody continuum (dashed blue and orange lines); (3) the 3 μm band of solid H2O ice, using the template from GC IRS 7 (Jang et al. 2022); and (4) the 10 μm and 18 μm silicate bands from the GC IRS 3 spectrum (Kemper et al. 2004). Other weaker absorption features were not included in the modelling. Spectra and their best-fitting models for the additional objects are shown in Appendix A. |
| In the text | |
|
Fig. 4 Distribution of extinction and H2O ice column densities derived from the global fits to the composite spectra. The two extinction estimates, |
| In the text | |
|
Fig. 5 Schematic illustration of the light-ray geometry probed by the composite spectra. A*K reflects extinction constrained mainly by the near-IR, while |
| In the text | |
|
Fig. 6 Optical depth spectra of CMZ sources exhibiting 3.535 μm solid CH3OH absorption at >2.5σ significance. The red line shows the best-fit model for pure solid CH3OH ice, and the shaded area denotes the ±1σ confidence interval. Spectra for the remaining sources are provided in Appendix B. |
| In the text | |
|
Fig. 7 Methanol-ice column densities against foreground extinction estimates ( |
| In the text | |
|
Fig. 8 Mixing ratios of CH3OH ice to the shoulder component of CO2 ice. Circles and arrows in the top panels indicate measurements and 3σ upper limits, respectively, for the red CMZ objects in this study (left) and for YSOs in the Galactic disc (Pontoppidan et al. 2008, right). In the bottom two panels, probability density functions of the mixing ratio N(solidCH3OH)/N(CO2 shoulder) are shown for the CMZ and disc YSOs, respectively. Thin lines correspond to individual measurements, assuming a bivariate normal distribution for the measured column densities and their 1sgr; uncertainties; the thick line shows the sum of all distributions. |
| In the text | |
|
Fig. 9 Column densities of H2O ice (top) and CH3OH ice (bottom) as a function of reduced extinction, |
| In the text | |
|
Fig. 10 Relative abundance of CH3 OH ice in the CMZ sources, shown with respect to H2O ice (top panel) and to the CO2 shoulder component (bottom panel), as a function of reduced extinction |
| In the text | |
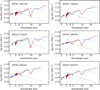 |
Fig. A.1 Same as Fig. 3, but showing the composite spectra of the remaining red CMZ sources. |
| In the text | |
|
Fig. A.1 Spectra of the sample sources (continued). |
| In the text | |
|
Fig. A.1 Spectra of the sample sources (continued). |
| In the text | |
|
Fig. B.1 Same as Fig. 6, but showing the optical-depth spectra of the remaining CMZ sources with non-significant 3.535 μm absorption. |
| In the text | |
|
Fig. C.1 Optical depth spectra of CMZ objects showing the 9.74 μm absorption feature of CH3OH ice. Only the three sources detected at > 2.5σ are displayed. |
| In the text | |
Current usage metrics show cumulative count of Article Views (full-text article views including HTML views, PDF and ePub downloads, according to the available data) and Abstracts Views on Vision4Press platform.
Data correspond to usage on the plateform after 2015. The current usage metrics is available 48-96 hours after online publication and is updated daily on week days.
Initial download of the metrics may take a while.