Fig. 3
Download original image
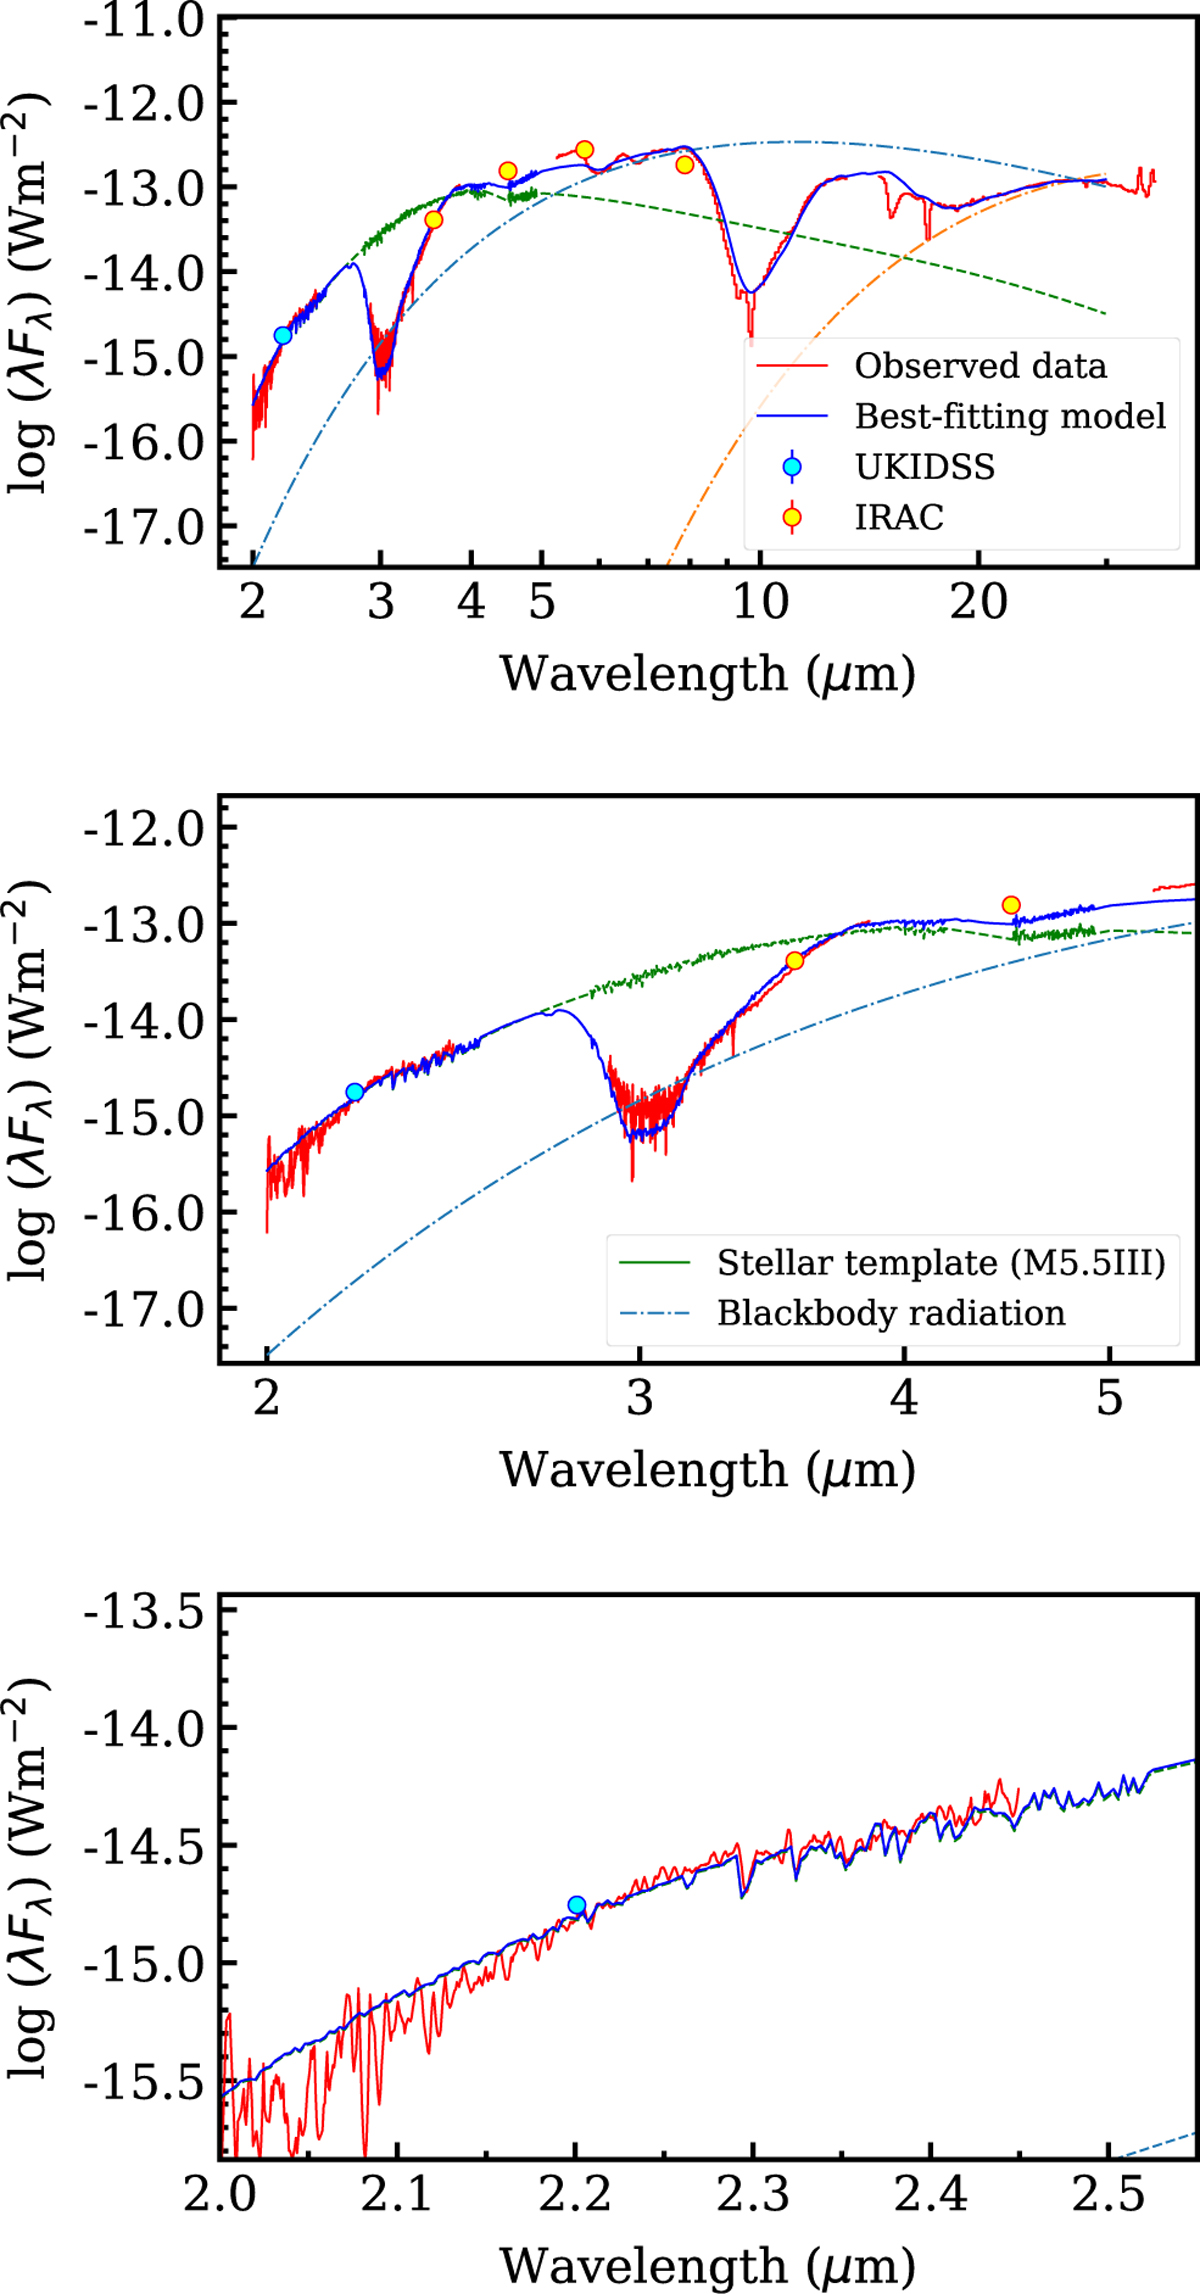
Composite IR spectrum of a red CMZ object (SSTGC 799887) and modelling of the SED. The observed spectra are shown as a solid red line, constructed by combining near-IR data from Gemini/GNIRS with mid-IR data from Spitzer/IRS. Circles represent photometric measurements from UKIDSS and Spitzer/IRAC, which were used to set the flux scale of the spectra (see text). The solid blue line shows the best-fitting model to the observed spectra, which included the following components: (1) a template of an M5.5-type giant from the IRTF/SpeX spectral library (Rayner et al. 2009) (green line); (2) a two-component blackbody continuum (dashed blue and orange lines); (3) the 3 μm band of solid H2O ice, using the template from GC IRS 7 (Jang et al. 2022); and (4) the 10 μm and 18 μm silicate bands from the GC IRS 3 spectrum (Kemper et al. 2004). Other weaker absorption features were not included in the modelling. Spectra and their best-fitting models for the additional objects are shown in Appendix A.
Current usage metrics show cumulative count of Article Views (full-text article views including HTML views, PDF and ePub downloads, according to the available data) and Abstracts Views on Vision4Press platform.
Data correspond to usage on the plateform after 2015. The current usage metrics is available 48-96 hours after online publication and is updated daily on week days.
Initial download of the metrics may take a while.