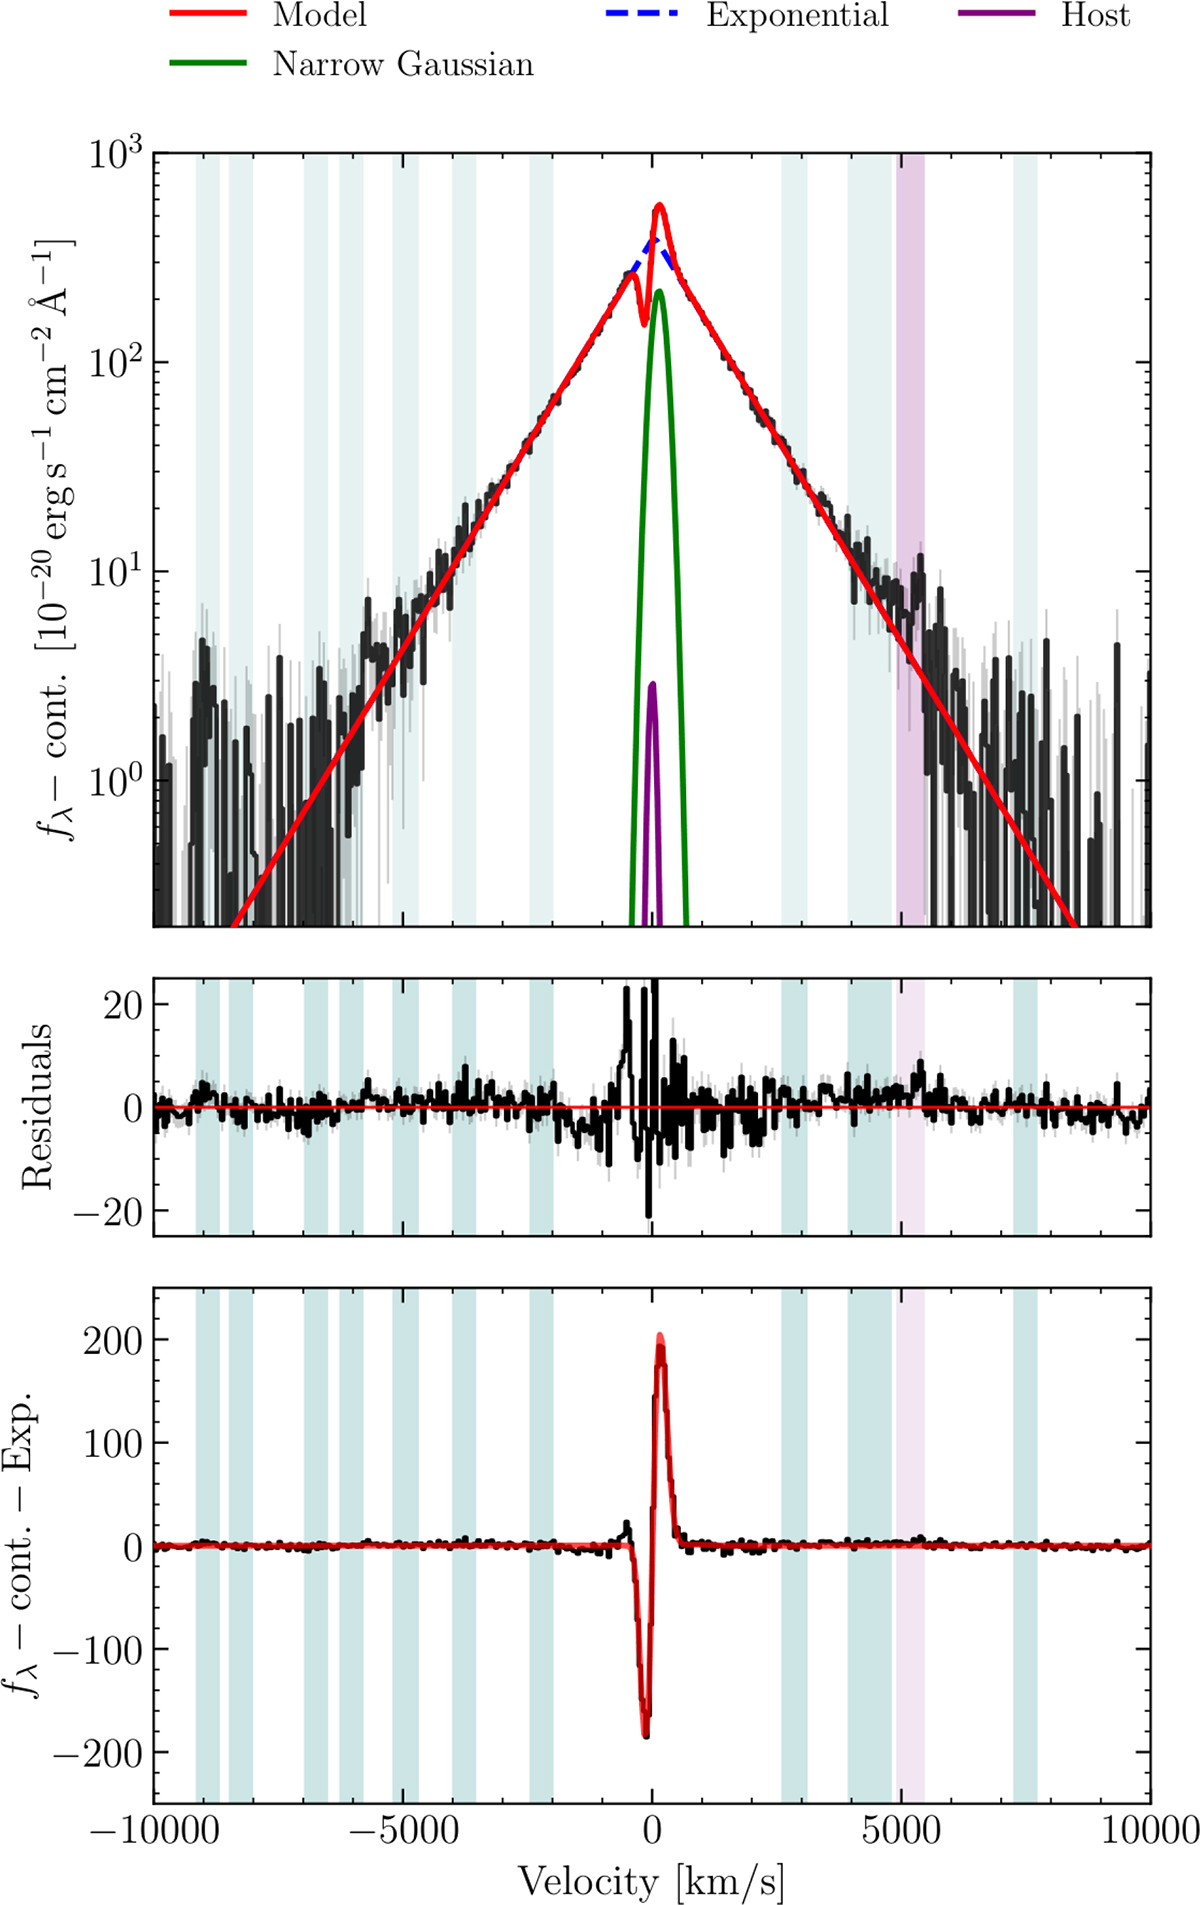
Fig. 2.
Download original image
Triangular P Cygni Hα spectrum of GN-9771. The continuum-subtracted Hα spectrum based on the G395H data is shown in black, whereas the red line shows the best-fit combined model (BIC = 932). Residuals to the model are shown in the middle panel. The fiducial fitting model is described in Sect. 3.1. We indicate the masked regions based on the locations of possible narrow [Fe II] emission in Véron-Cetty et al. (2004) (teal) and He Iλ6680 (purple). The [N II] component is not shown due to its relative flux being negligible. The bottom panel shows the Hα spectrum and best fit after subtracting the exponential component to highlight the P Cygni profile.
Current usage metrics show cumulative count of Article Views (full-text article views including HTML views, PDF and ePub downloads, according to the available data) and Abstracts Views on Vision4Press platform.
Data correspond to usage on the plateform after 2015. The current usage metrics is available 48-96 hours after online publication and is updated daily on week days.
Initial download of the metrics may take a while.