Fig. 4.
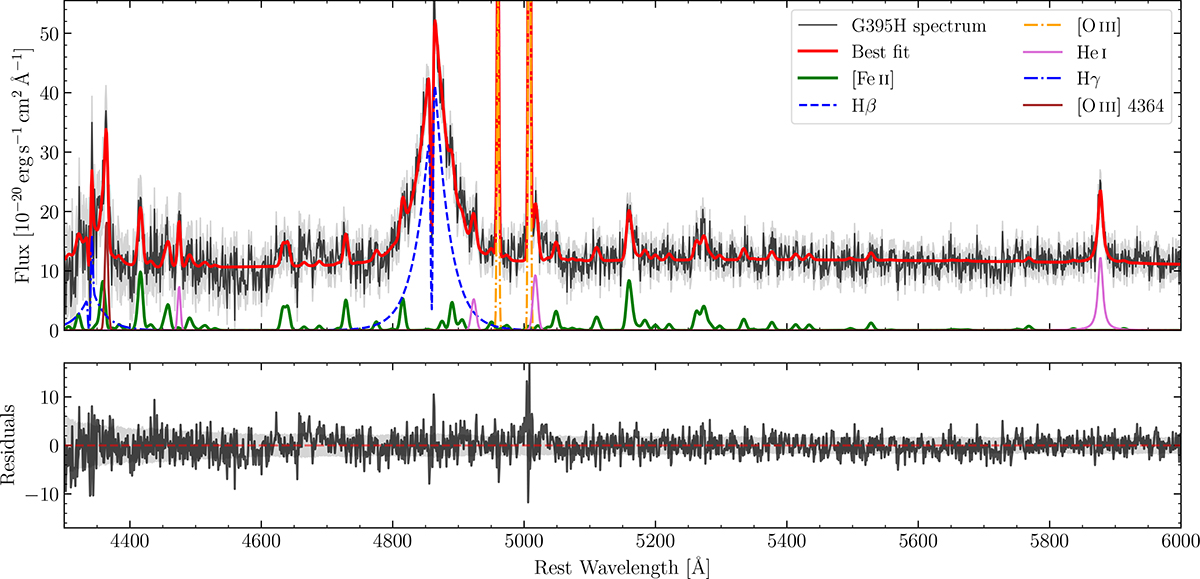
Download original image
[Fe II] forest detected in the G395H data over the ∼5000 Å region of GN-9771. We show the fitted [Fe II] spectrum as described in Sect. 3.3 (green), the He I lines (pink), Hγ (blue dot-dashed), the Hβ model (blue dashed), [O III] λλ4960, 5008 (orange dot-dashed), and [O IIIλ4364 (brown). The residuals of the fit as well as the observational uncertainties on the spectrum are shown in the bottom panel.
Current usage metrics show cumulative count of Article Views (full-text article views including HTML views, PDF and ePub downloads, according to the available data) and Abstracts Views on Vision4Press platform.
Data correspond to usage on the plateform after 2015. The current usage metrics is available 48-96 hours after online publication and is updated daily on week days.
Initial download of the metrics may take a while.