Fig. 5.
Download original image
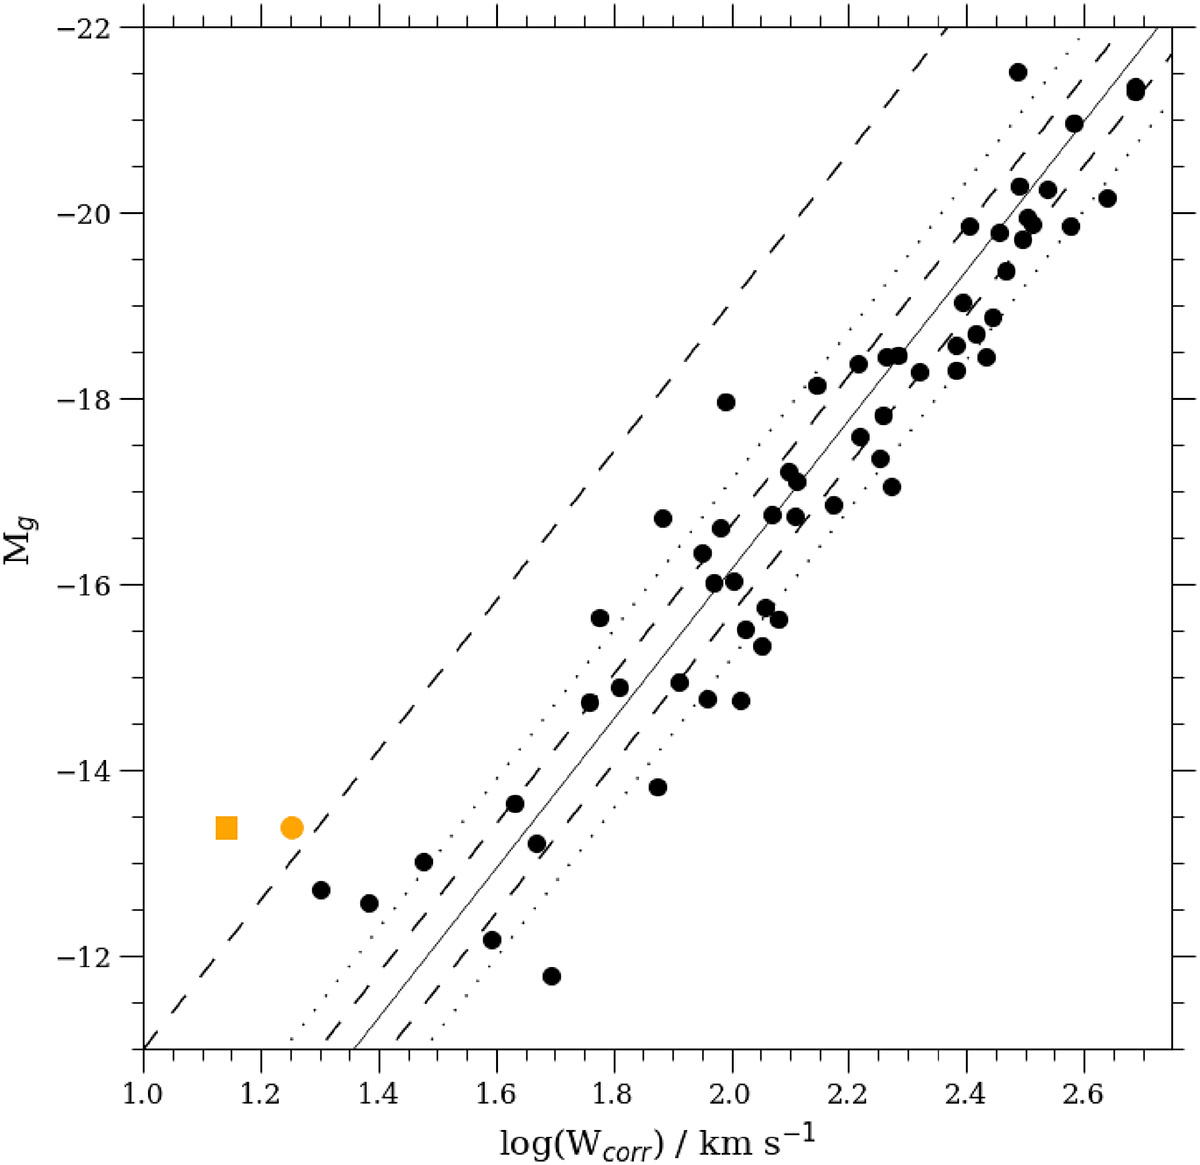
Optical form of the TFR following the method of K20. Black points are our AGES galaxies, with VCC 1964 highlighted in orange (as in Figure 3 the orange square uses H I data without Hanning smoothing). The solid line is the relation obtained in K20 with the dashed and dotted lines showing their estimated 1 and 2σ scatter. The upper dashed line shows the 6σ deviation.
Current usage metrics show cumulative count of Article Views (full-text article views including HTML views, PDF and ePub downloads, according to the available data) and Abstracts Views on Vision4Press platform.
Data correspond to usage on the plateform after 2015. The current usage metrics is available 48-96 hours after online publication and is updated daily on week days.
Initial download of the metrics may take a while.