Fig. 2
Download original image
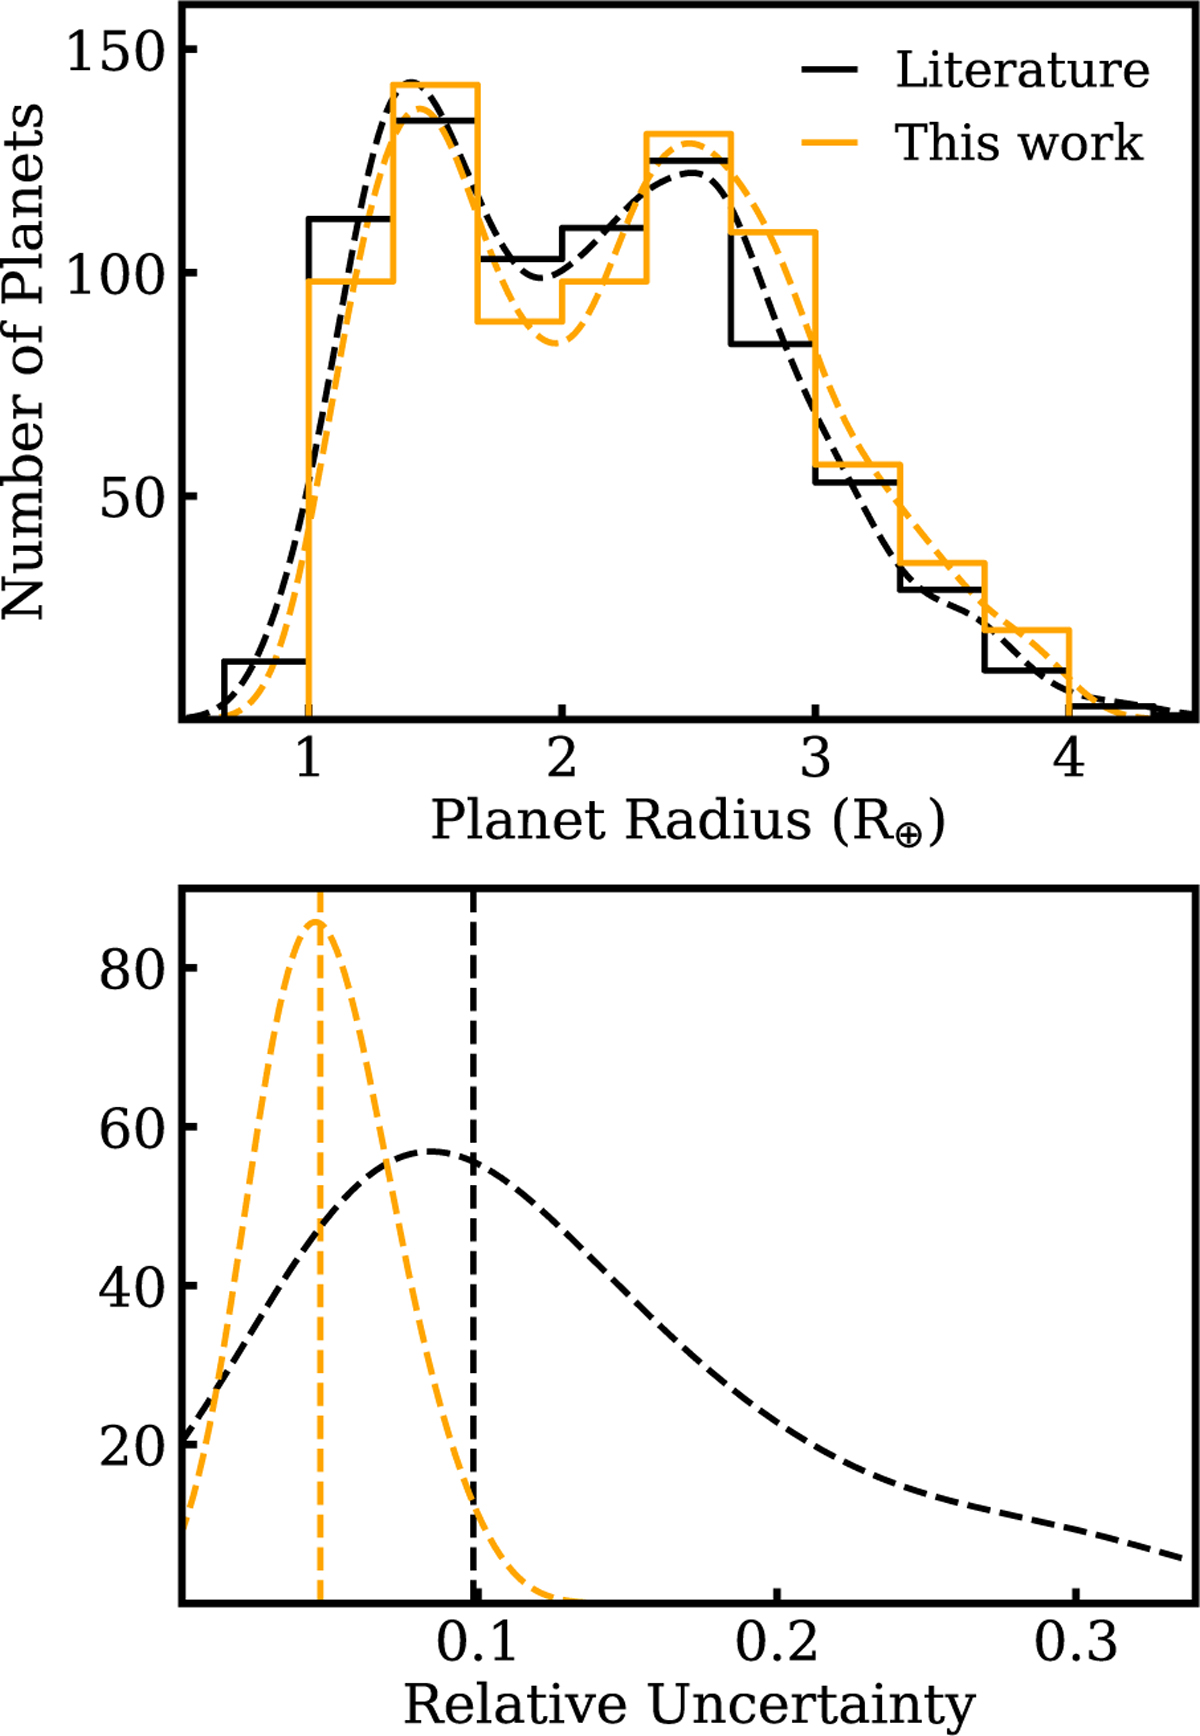
Top panel: histograms of planet radii from the literature (black) and our revised values (orange), using 0.33 R⊕ bin width. Dashed curves represent kernel density estimates (KDEs) computed with 0.33 R⊕ bandwidth. Lower panel: KDE distributions of radius uncertainties, with vertical dashed lines indicating the medians: 0.05 (this work) and 0.10 (literature values from the NASA Exoplanet Archive).
Current usage metrics show cumulative count of Article Views (full-text article views including HTML views, PDF and ePub downloads, according to the available data) and Abstracts Views on Vision4Press platform.
Data correspond to usage on the plateform after 2015. The current usage metrics is available 48-96 hours after online publication and is updated daily on week days.
Initial download of the metrics may take a while.