Fig. 5
Download original image
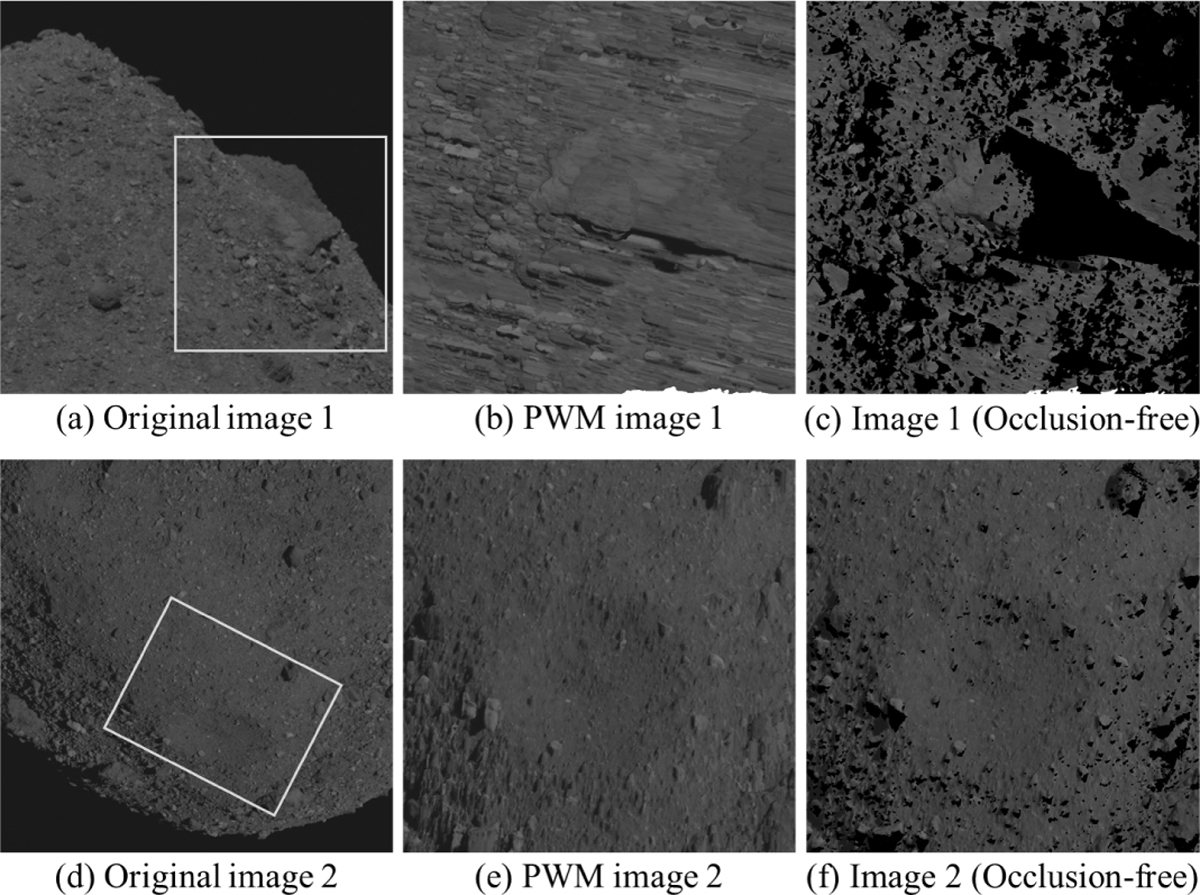
Results of visibility checking (each row corresponds to one region). Panels (a) and (d) are the original images (20190419T202633S865_map; 20190516T213136S334_map), and the gray box indicates the location of the region. Panels (b) and (e) are the PWM-aligned images containing the occluded pixels. Panels (c) and (f) are the PWM-aligned images with occluded pixels removed (black pixels).
Current usage metrics show cumulative count of Article Views (full-text article views including HTML views, PDF and ePub downloads, according to the available data) and Abstracts Views on Vision4Press platform.
Data correspond to usage on the plateform after 2015. The current usage metrics is available 48-96 hours after online publication and is updated daily on week days.
Initial download of the metrics may take a while.