Fig. 2.
Download original image
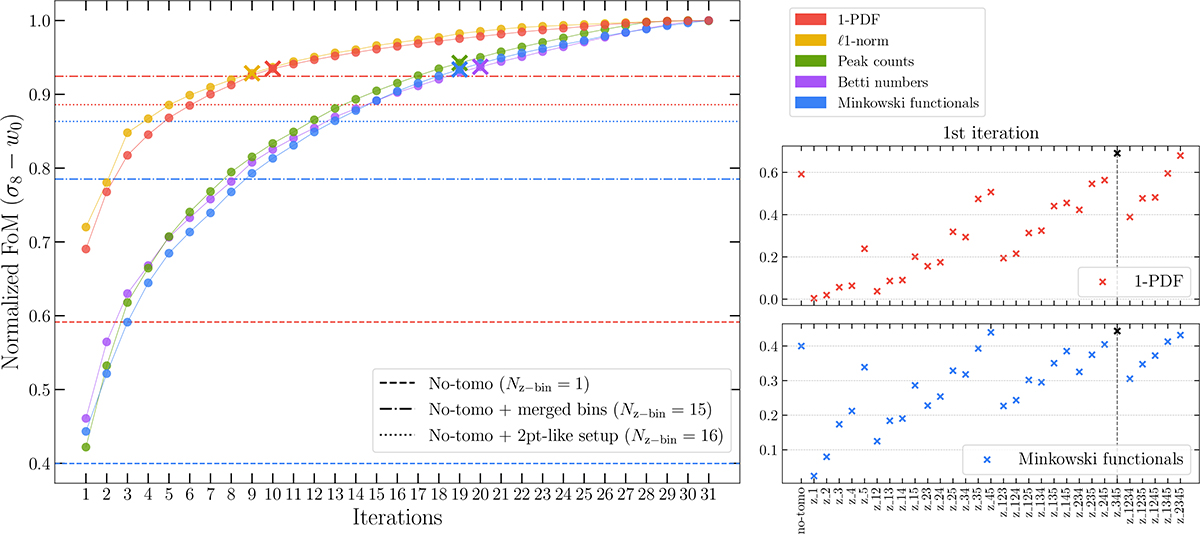
Optimal tomographic DV selection for the reference setup with a smoothing radius of 2![]() 34. Main panel: Colored dots show the normalized FoM for each HOS at successive iterations of the greedy algorithm, descibed in Sect. 5.1. The FoM for each statistic is normalized to its full-tomography value. The colored crosses indicate the iteration where the 1% improvement threshold is reached; bins beyond this point contribute negligible information and were discarded. Horizontal lines mark reference configurations: non-tomographic (dashed), non-tomographic with merged bins (dash-dotted), and non-tomographic with two-point-like setup (dotted). Only κ-1PDF and κ-MFs are shown as representatives of one-point and topological statistics. Right panels: FoM contribution from individual tomographic bins shown for κ-1PDF and κ-MFs, with the most constraining bin highlighted in black.
34. Main panel: Colored dots show the normalized FoM for each HOS at successive iterations of the greedy algorithm, descibed in Sect. 5.1. The FoM for each statistic is normalized to its full-tomography value. The colored crosses indicate the iteration where the 1% improvement threshold is reached; bins beyond this point contribute negligible information and were discarded. Horizontal lines mark reference configurations: non-tomographic (dashed), non-tomographic with merged bins (dash-dotted), and non-tomographic with two-point-like setup (dotted). Only κ-1PDF and κ-MFs are shown as representatives of one-point and topological statistics. Right panels: FoM contribution from individual tomographic bins shown for κ-1PDF and κ-MFs, with the most constraining bin highlighted in black.
Current usage metrics show cumulative count of Article Views (full-text article views including HTML views, PDF and ePub downloads, according to the available data) and Abstracts Views on Vision4Press platform.
Data correspond to usage on the plateform after 2015. The current usage metrics is available 48-96 hours after online publication and is updated daily on week days.
Initial download of the metrics may take a while.