Fig. 5.
Download original image
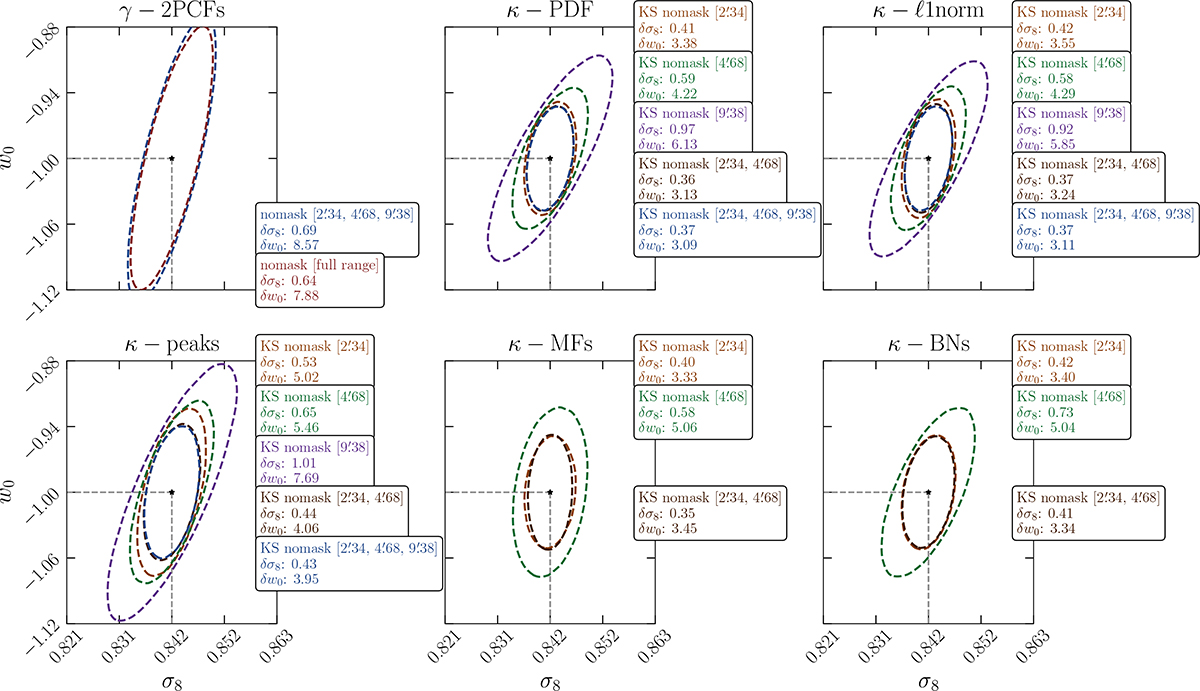
Multi-scale contour plots of the reference setup (KS, top-hat filter) without masks for γ-2PCFs and HOS. Fisher forecasts are computed for each individual scale of 2![]() 34 (orange), 4
34 (orange), 4![]() 69 (green), 9
69 (green), 9![]() 38 (purple); concatenation of 2
38 (purple); concatenation of 2![]() 34 and 4
34 and 4![]() 69 (brown); concatenation of 2
69 (brown); concatenation of 2![]() 34, 4
34, 4![]() 69, and 9
69, and 9![]() 38 (cyan); and the full-range of scales for γ-2PCFs (red). MFs and BNs do not exhibit the highest smoothing scale (9
38 (cyan); and the full-range of scales for γ-2PCFs (red). MFs and BNs do not exhibit the highest smoothing scale (9![]() 38) since it does not satisfy the SMAPE criterion.
38) since it does not satisfy the SMAPE criterion.
Current usage metrics show cumulative count of Article Views (full-text article views including HTML views, PDF and ePub downloads, according to the available data) and Abstracts Views on Vision4Press platform.
Data correspond to usage on the plateform after 2015. The current usage metrics is available 48-96 hours after online publication and is updated daily on week days.
Initial download of the metrics may take a while.