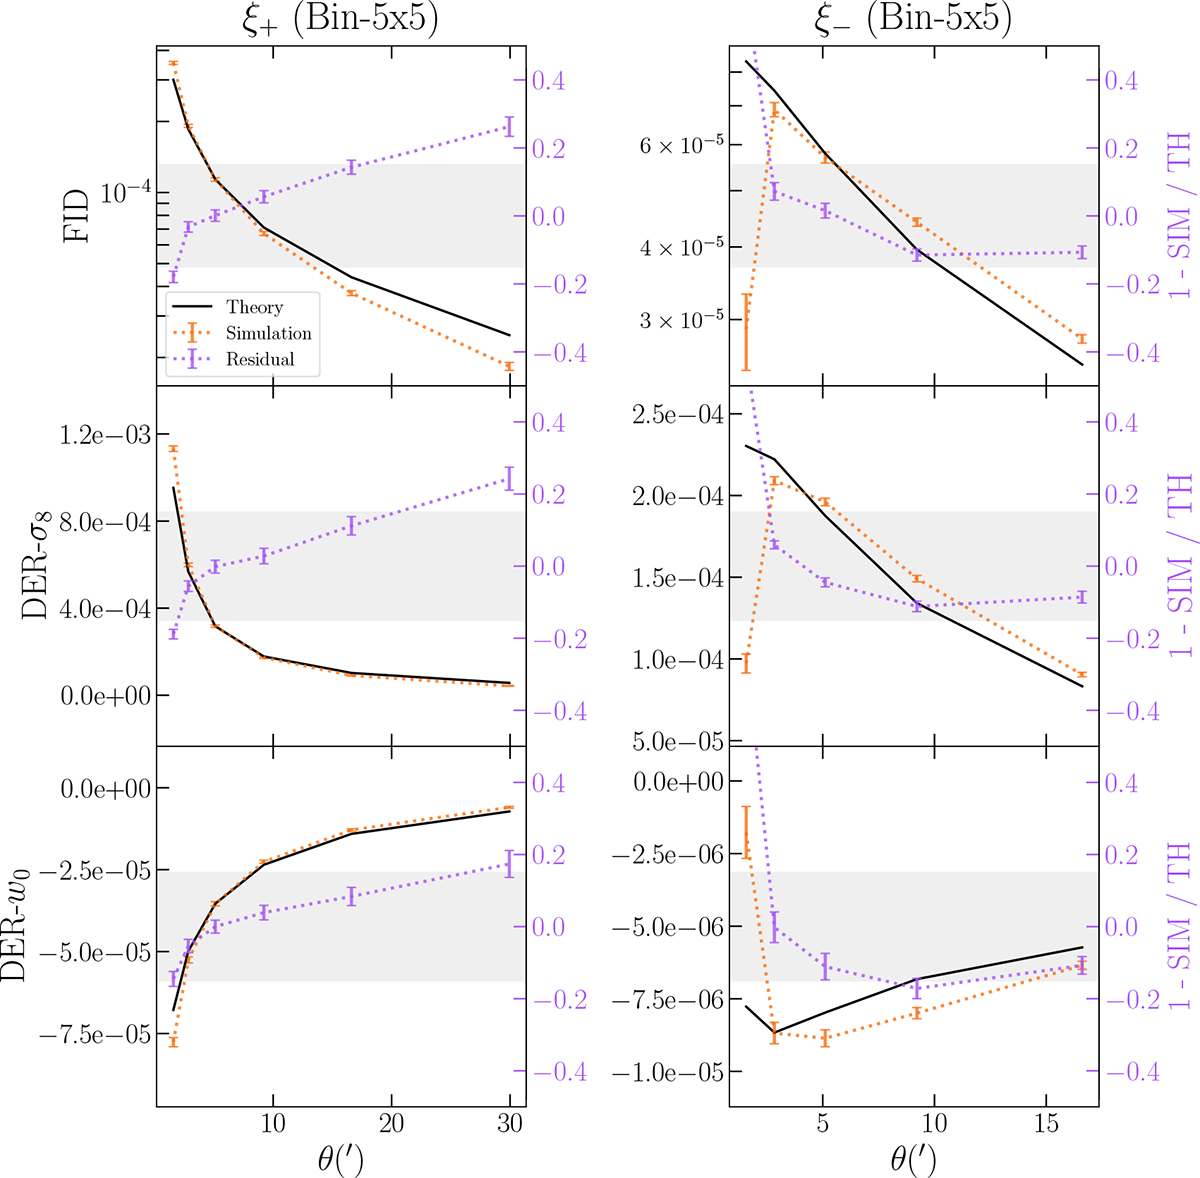
Fig. 6.
Download original image
Shear two-point correlation functions (upper panel) and derivatives (lower panels) DV comparison for bin five between the mean computed from DUSTGRAIN mocks (orange) and theory predictions (black) for the fiducial cosmology (top), σ8 (middle), and w0 (bottom) derivatives. Fractional residuals are reported in purple on the secondary y-axis, emphasizing a 15% threshold as a gray-shaded horizontal band.
Current usage metrics show cumulative count of Article Views (full-text article views including HTML views, PDF and ePub downloads, according to the available data) and Abstracts Views on Vision4Press platform.
Data correspond to usage on the plateform after 2015. The current usage metrics is available 48-96 hours after online publication and is updated daily on week days.
Initial download of the metrics may take a while.