Fig. 1
Download original image
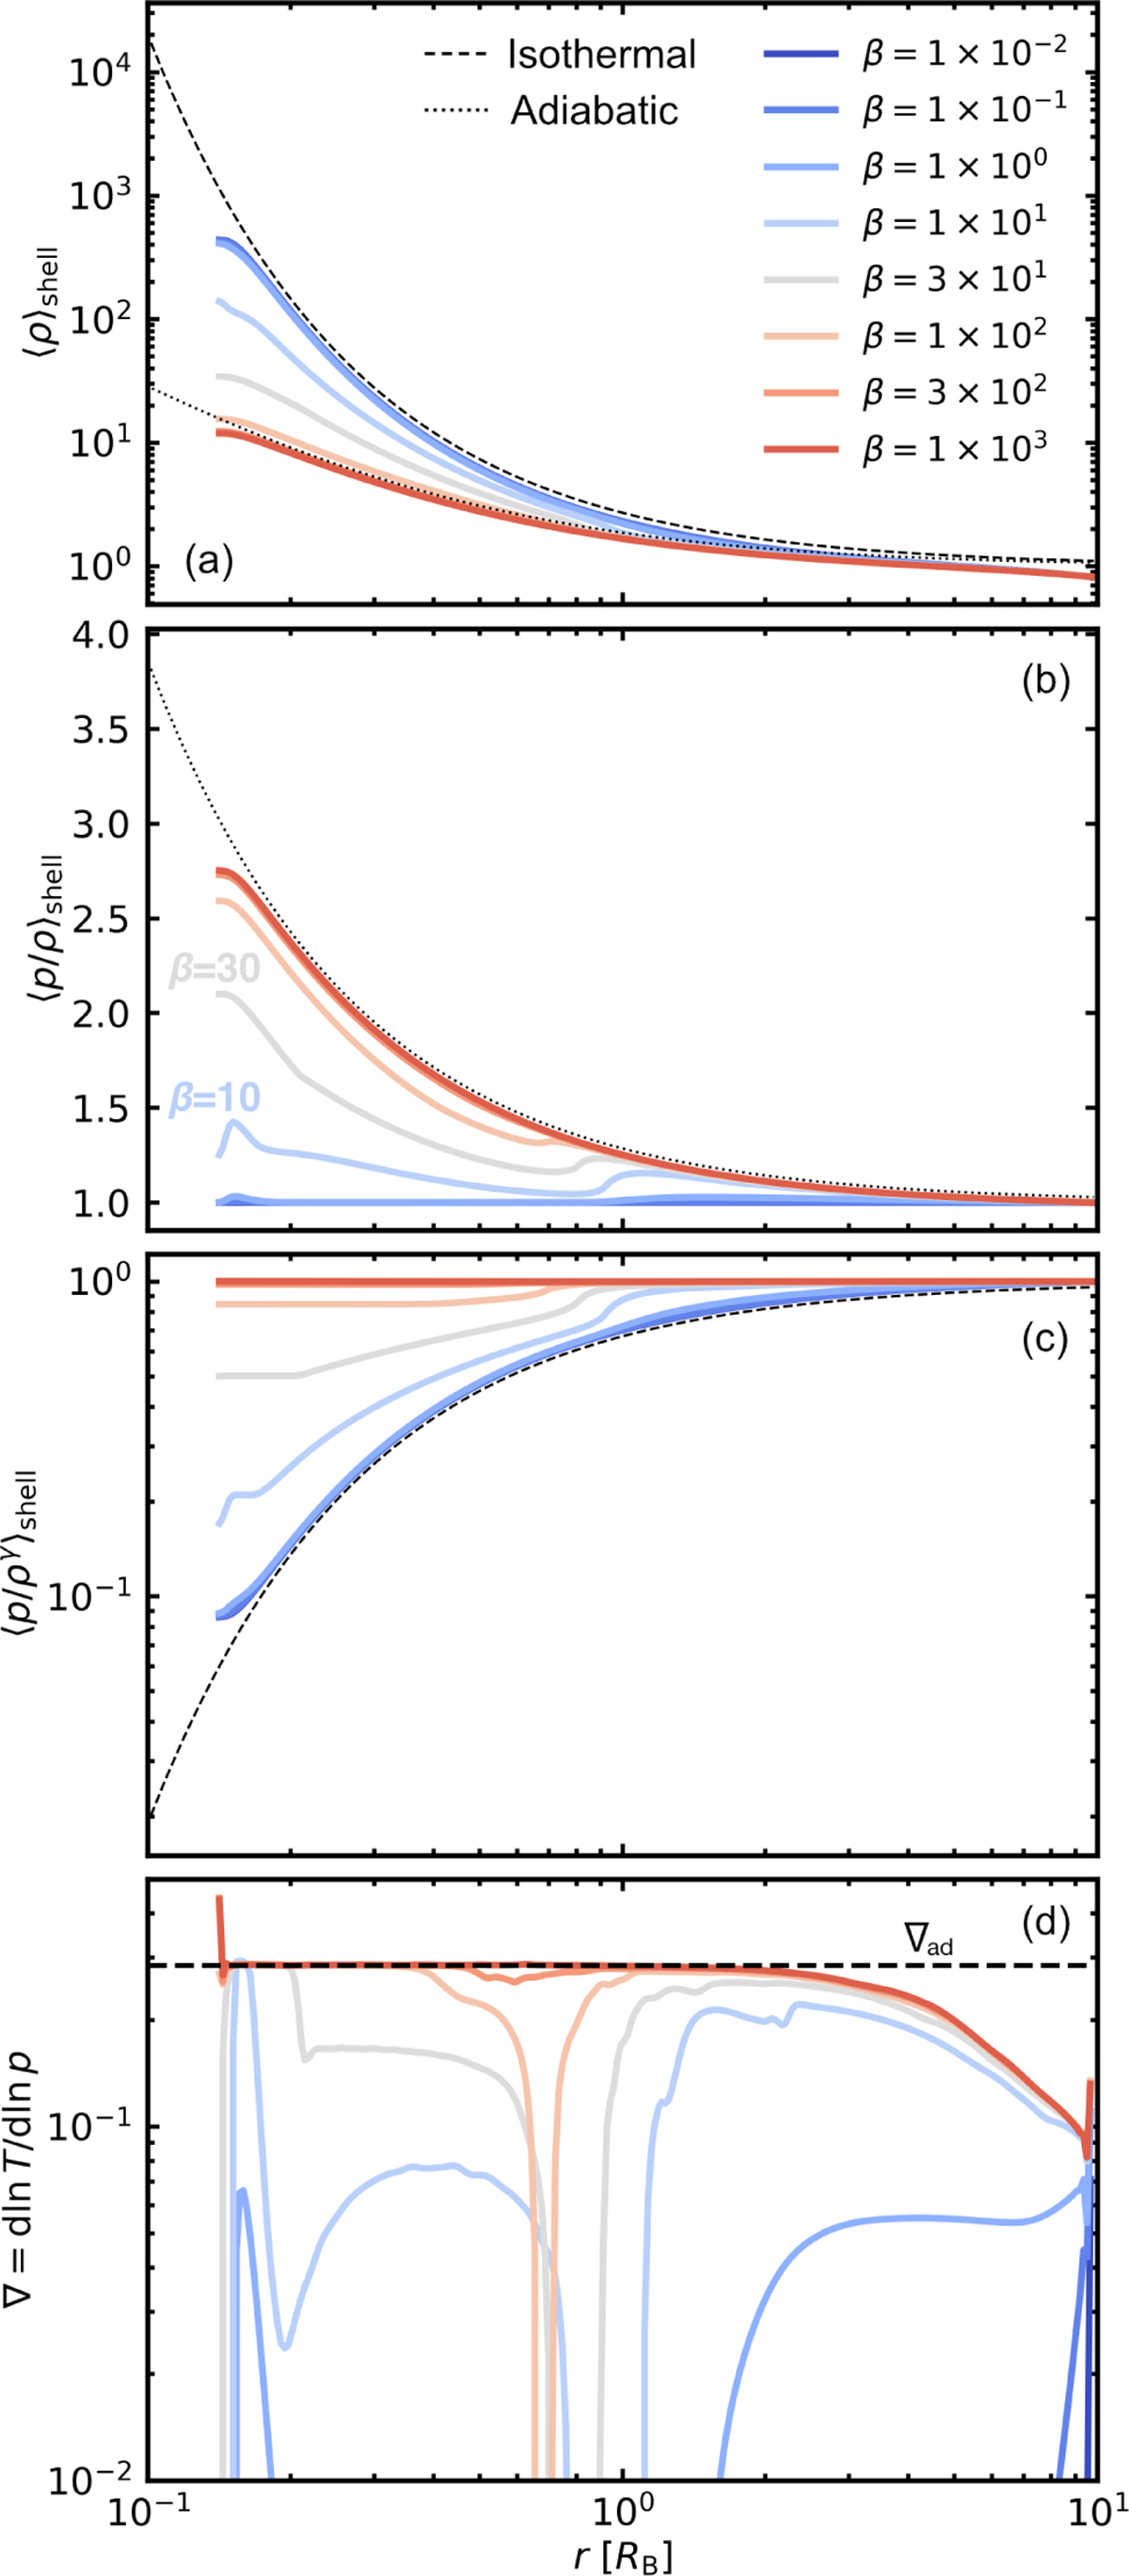
Shell-averaged density, temperature, entropy, and temperature gradient (from top to bottom) for different β values. We set m=0.1 and Ṁ=10 M⊕/Myr. All panels are the snapshots at the end of the calculation, t=50. The dashed and dotted curves in panels a–c are the analytic models given by Eqs. (18), (25), and (26). The horizontal dashed line in panel d is the adiabatic gradient, Eq. (20).
Current usage metrics show cumulative count of Article Views (full-text article views including HTML views, PDF and ePub downloads, according to the available data) and Abstracts Views on Vision4Press platform.
Data correspond to usage on the plateform after 2015. The current usage metrics is available 48-96 hours after online publication and is updated daily on week days.
Initial download of the metrics may take a while.